US Winery Market Outlook: Market Size and Projections to 2030

US wineries generated $21.7 billion in revenue in 2024, down 7.0% on 2023 and 10.9% below the 2022 peak of $24.3 billion.
The industry ran 4,584 establishments and employed 64,401 people. On the projection set out below it recovers to $21.6 billion by 2030, which leaves it still 11.0% below where it stood in 2022.
This is a contraction, and the input data confirms it rather than contradicting it. Cost of materials fell 20.0% in 2024, operating expenses fell 16.5%, employment fell 3.7% and inventories fell 3.6%. Producers are buying less fruit, employing fewer people and running down stock.
The Market Peaked in 2022
Revenue moved from $20.9 billion in 2017 to a trough of $19.8 billion in 2019 and 2020, then jumped 19.8% in 2021 to $23.7 billion and peaked at $24.3 billion in 2022. It has fallen in both years since.

Across the full eight years of actuals the compound growth rate is 0.5% a year. The 2021 and 2022 figures are the outliers in this series, not the 2024 figure.
Two Consecutive Years of Decline
Revenue fell 4.2% in 2023 and 7.0% in 2024, a two-year compound decline of 5.6% a year.


What makes the recent decline notable is that the number of businesses kept rising. Firms went from 3,577 in 2017 to 4,373 in 2022, up 22.3%, and establishments from 3,709 to 4,584, up 23.6%. More wineries are competing for a revenue pool that has stopped growing.
Where the Market Lands in 2030
On the projection used here the market declines for a further two years, bottoms near $20.7 billion in 2026 and recovers slowly to $21.6 billion by 2030.
That is a flat six years. The projection is built this way because the decline in the actuals is not confined to revenue: it runs through fruit purchasing, headcount and stock at the same time, which is the pattern of an industry adjusting capacity down rather than absorbing one soft year. Once that adjustment works through, the eight-year growth rate of 0.5% is the most defensible description of the underlying market.

Wine Is 90.3% of Revenue, Hospitality Is 3.2%
Broken out by product line, wine manufacturing accounts for $21.9 billion of the 2022 total, or 90.3%. Table wines at 14% alcohol or less alone account for 81.8%.
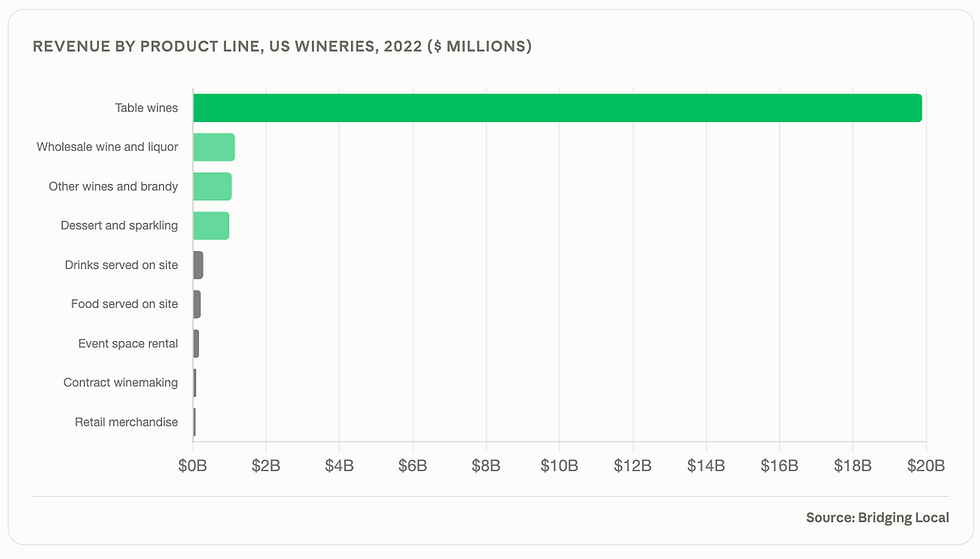
The hospitality lines that dominate winery marketing are a small part of the money. Drinks served on site, food served on site, event and wedding space rental, retail merchandise, retail alcohol and tour services together come to $776.5 million, or 3.2% of revenue.

One further figure is worth carrying. Of the $24.3 billion in 2022 revenue, $13.3 billion was shipped against electronically placed orders, or 54.7%. Over half of this industry's sales now originate through an electronic order channel, whether a trade order from a distributor or a direct consumer purchase.
Costs Fell Twice as Fast as Revenue
Operating expenses fell from $17.5 billion in 2023 to $14.6 billion in 2024, a decline of 16.5%. Revenue over the same year fell 7.0%.
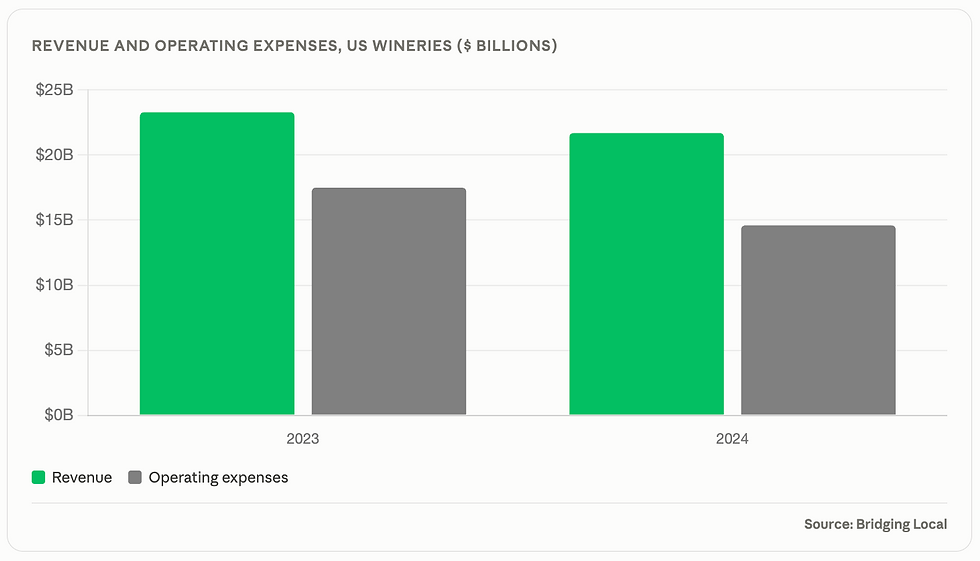
The cut came out of materials. Cost of materials fell from $10.1 billion to $8.1 billion, down 20.0%, and now stands at 37.4% of revenue. In an industry where materials means grapes, bulk wine, glass, closures and packaging, a 20% cut in one year is a deliberate reduction in what is being made.
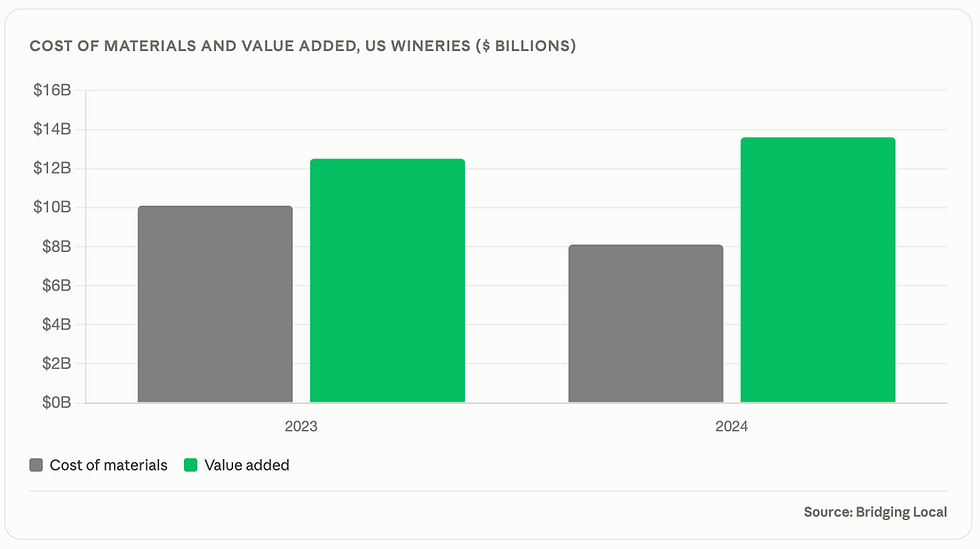
Value added moved the other way, rising 8.6% to $13.6 billion, or 62.6% of revenue. The industry sold less wine but captured more value per dollar of input, which is what happens when producers stop buying fruit and sell through wine they already hold.
$14.8 Billion Is Sitting in Inventory
End of year inventories stood at $14.8 billion in 2024, equal to 68.3% of annual revenue, or roughly 8.2 months of sales.
Work in process accounts for $9.5 billion of that total, 64.1% of all inventory. This is wine in tank and barrel: product that has been paid for in grapes, labour and packaging but cannot be sold until it has finished ageing.

Finished goods account for $4.4 billion, 29.7%, and materials and supplies $0.9 billion.
Why this number governs the whole business. No other food or beverage category carries two thirds of a year's revenue as stock, most of it unsellable for months or years. It means a winery's working capital requirement is enormous relative to turnover, that a bad vintage decision is locked in long before it reaches a shelf, and that a demand downturn cannot be met by cutting production this year. The 2024 cost reductions will show up in what is available to sell in 2026 and 2027.
Revenue Per Employee Is Falling
Revenue per employee fell from $382,886 in 2022 to $336,337 in 2024, a decline of 12.2%.
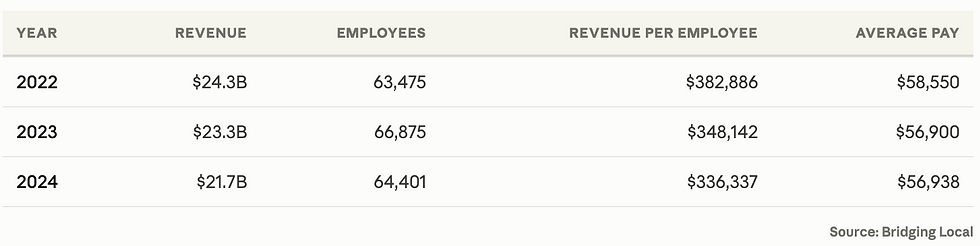
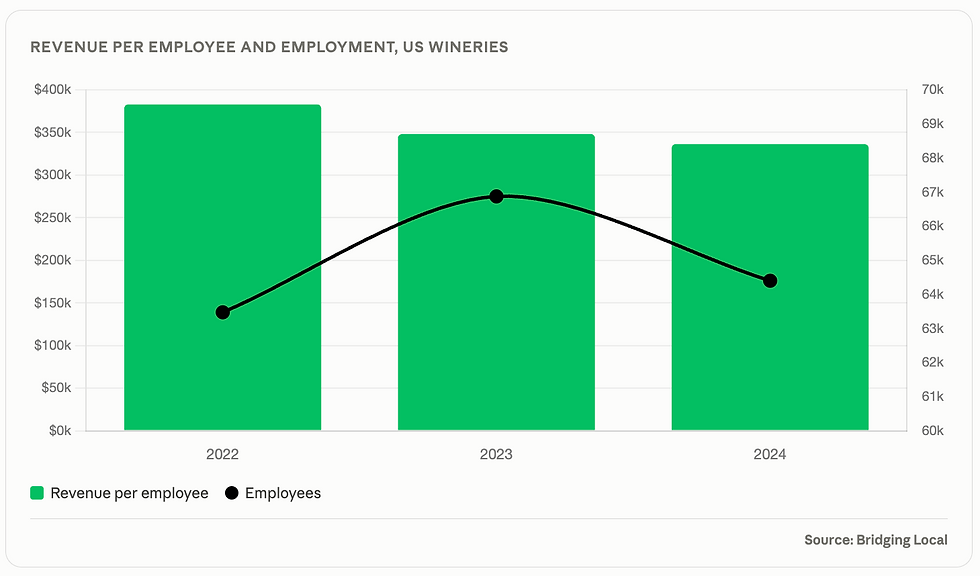
Employment rose to 66,875 in 2023 before falling to 64,401 in 2024. Payroll took 16.9% of revenue in 2024 against 15.3% in 2022, so labour's claim on each dollar rose as revenue fell.
Production workers numbered 26,495 in 2024, 41.1% of all employees, at average wages of $51,056. Average pay across the whole workforce was $56,938, and employer fringe benefit costs added a further $803.7 million, equal to 21.9% of payroll.
Partnerships Are the Dominant Business Form
Sorted by legal form, partnerships are the largest group in the industry by both site count and employment.
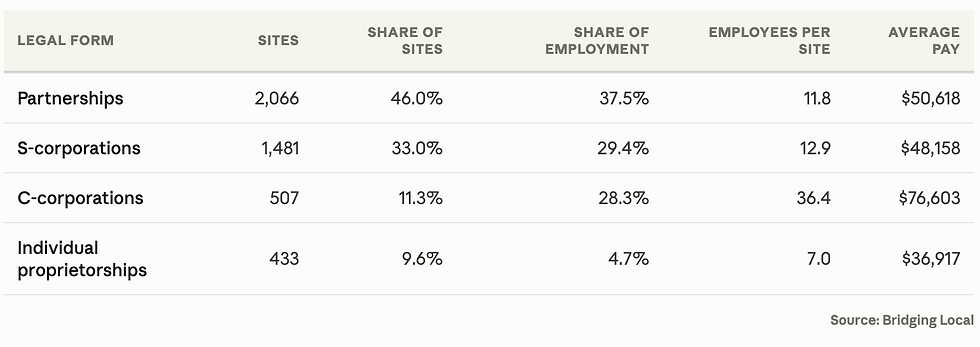
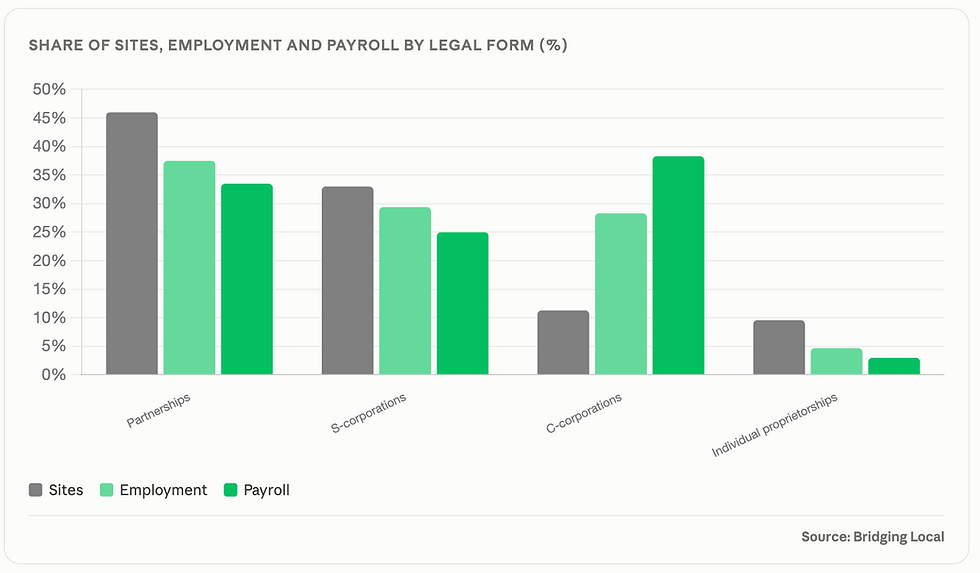
C-corporations are one site in nine but 28.3% of employment and 38.3% of payroll, averaging 36.4 employees per site against 11.8 for partnerships. They pay $76,603 a head against $50,618.
That split describes two different industries sharing one classification. The C-corporation segment is large-scale production with professional management. The partnership and S-corporation segments are family and investor-owned estates running on a dozen people each.
41.9% of Wineries Have Fewer Than Five Employees
Of the establishments whose size band is published, 41.9% have fewer than five employees, 65.0% have fewer than ten and 83.3% have fewer than twenty.

At the other end, the 4.9% of sites with 50 or more employees hold 38.2% of the employment in those bands. Average revenue per establishment across the industry was $5.3 million in 2022, but that average sits well above what the typical winery earns, because a small number of large producers pull it upward.
A separate group sits outside these figures entirely: 1,500 nonemployer wineries, businesses with no payroll, generated $169.2 million in 2023, an average of $112,777 each.
135 Firms Hold 34.1% of the Revenue
Of 4,089 employer firms, 3,954 resolve to identifiable individual owners and 135 do not, the latter being publicly traded companies and large partnerships.
Those 135 firms are 3.3% of the count and 34.1% of the revenue, averaging $60.7 million each against $4.0 million for the owner-identified firms, 15.2 times the scale.

By comparison with most manufacturing categories this is moderate concentration. Two thirds of the revenue still sits with firms that have identifiable individual owners, which is unusual at this scale and reflects how much of the industry remains in family hands.
Within those owner-identified firms, male-owned firms are 53.7% of the count and 79.5% of the revenue. Equally owned firms are 30.7% of the count and 11.1% of revenue. Female-owned firms are 15.7% of the count and 9.3% of revenue, at average revenue of $2.4 million against $5.9 million for male-owned firms.

What we do at Bridging Local
We run custom research for businesses that need answers national datasets cannot provide. That means price tier and category analysis in defined markets, distributor and trade interviews, direct to consumer channel testing, competitor and shelf analysis, tasting room and visitor demand sizing, and revenue modelling built from the ground up for a specific label or site.
For producers, investors and acquirers, that usually looks like sizing the addressable demand for a specific tier and region, understanding competitive pricing and listings, testing a label or format with the people who would buy it, or building the evidence a lender, board or acquirer will ask for.
If you are launching, expanding or investing in a winery and need evidence rather than inference, that is the work we do. Custom surveys, trade interviews, competitive analysis and regional demand sizing, built around your specific decision.
Frequently Asked Questions
How big is the US winery market?
US wineries generated $21.7 billion in revenue in 2024, down from $23.3 billion in 2023 and a peak of $24.3 billion in 2022. The industry ran 4,584 establishments and employed 64,401 people. On the projection in this report it reaches $21.6 billion by 2030, still 11.0% below the 2022 peak.
Is the US wine industry growing or shrinking?
Shrinking over the last two years. Revenue fell 4.2% in 2023 and 7.0% in 2024. Over the full eight years of available data the compound growth rate is 0.5% a year, so the longer view is a flat market rather than a collapsing one. The 2021 and 2022 figures are the outliers in the series.
Why is winery revenue falling while margins improve?
Because producers cut inputs faster than sales fell. Cost of materials dropped 20.0% in 2024 and operating expenses 16.5%, against a 7.0% revenue decline, so the gap between revenue and operating expenses widened from 24.6% to 32.4%. Much of the improvement comes from selling through wine already held in stock rather than buying new fruit.
How much inventory does a winery carry?
Industry inventories stood at $14.8 billion in 2024, equal to 68.3% of annual revenue or about 8.2 months of sales. Work in process, meaning wine ageing in tank and barrel, is $9.5 billion of that, 64.1% of all inventory. Finished goods are $4.4 billion. This is the largest working capital requirement relative to turnover of any major food or beverage category.
How much of winery revenue comes from tasting rooms and events?
Less than most people assume. Drinks and food served on site, event and wedding space rental, retail merchandise, retail alcohol and tours together came to $776.5 million in 2022, or 3.2% of industry revenue. Wine manufacturing is 90.3%. Around a third of all establishments run a hospitality operation, so it is widespread but small in dollar terms at industry level.
How many wineries are there in the US and how big are they?
There were 4,373 employer firms running 4,584 establishments in 2022, up 22.3% and 23.6% on 2017. Average revenue per establishment was $5.3 million, but 41.9% of sites have fewer than five employees and 83.3% have fewer than twenty, so the typical winery is far smaller than the average suggests. A further 1,500 nonemployer wineries generated $169.2 million in 2023.
How concentrated is the US wine industry?
Moderately. Of 4,089 employer firms, 135 are large corporate entities holding 34.1% of revenue and averaging $60.7 million each, 15.2 times the scale of the rest. Two thirds of revenue still sits with firms that have identifiable individual owners, which is unusual for a manufacturing industry of this size.
About This Analysis
This analysis was produced by Bridging Local (RC Research & Insights Inc.), a Vancouver-based market research and business consulting firm. We run primary research across B2B and B2C markets, including surveys, in-depth interviews, competitive analysis, local market deep dives and go-to-market strategy.
If you are sizing a market, testing a concept, or working out where demand sits in your category, our market research services are built for exactly that.


