Waste Treatment and Disposal Market Outlook: US Market Size and Projections to 2030

The US hazardous waste treatment and disposal market reached $10.8 billion in 2024, growing near 10% a year. More than a third of that revenue comes from a single customer: the federal government.
The industry employed 30,547 people across 938 establishments and paid $2.8 billion in wages. On the projection set out below it reaches $15.6 billion by 2030.
This is not a market shaped like the rest of the waste industry. It has very few operators, very high revenue per worker, wages well above the service sector average, and one customer that accounts for more than a third of all revenue. Each of those facts changes how a business in this space should be sized, staffed and sold.
The Market Reached $10.8 Billion
Revenue stood at $10.8 billion in 2024, against $9.9 billion in 2023 and $9.0 billion in 2022.

Scale per site is the first thing that stands out. Spread across 938 establishments, the 2022 revenue works out to $9.6 million per site. This is an industry of permitted facilities and long contracts, not storefronts.
Growth Is Running Near 10% a Year
Both available growth years came in near 10%. Revenue rose 9.4% in 2023 and 9.9% in 2024, a two-year compound rate of 9.7%.

What makes this growth unusual is that employment barely moved. Headcount rose 2.1% across the same two years in which revenue rose 20.3%. The industry added $1.8 billion of revenue and 620 people.

Where the Market Lands in 2030
On the projection used here the market reaches $15.6 billion by 2030, adding $4.8 billion over six years at a 6.3% compound annual rate.

The rate steps down each year, from 7.5% in 2025 to 5.0% in 2030. Two years at near 10% is a strong run, but it is driven in part by pricing on long remediation contracts and by a backlog of site work that is finite. The projection holds the market well above general inflation while allowing the recent pace to ease.

Held at the 2022 customer mix, the federal share of that 2030 figure would be worth $5.8 billion and the commercial share $8.3 billion.
The Federal Government Is 37.2% of This Market
This is the structural fact that defines the industry. Of all revenue in 2024 terms, business firms and farms accounted for 53.0%, the federal government for 37.2%, household consumers for 4.2%, not-for-profit organisations for 3.1% and state and local governments for 2.5%.

Taken together, government at all levels is 39.7% of revenue, worth $3.6 billion on the 2022 base. No other waste or environmental service category is this dependent on public contracting, and it follows from what the work is: the largest hazardous sites in the country are legacy defence, energy and federal industrial properties, and the entity paying to clean them is the one that contaminated them.
Costs Rose 2.4% While Revenue Rose 9.9%
Operating expenses reached $9.0 billion in 2024 against $8.8 billion in 2023, a rise of 2.4%. Revenue over the same year rose 9.9%.

The gap between revenue and operating expenses widened from 10.9% of revenue to 17.0%, or from $1.1 billion to $1.8 billion in a single year. Costs grew at roughly a quarter the pace of sales.

Revenue Per Employee Is $354,775
Each employee in this industry supported $354,775 of revenue in 2024, up from $301,121 in 2022.


Revenue per employee rose 17.8% in two years while headcount rose 2.1%. The figure is high because the revenue is carried by permitted assets rather than by labour hours: an incinerator, a secure landfill cell or a treatment train generates revenue from throughput, and throughput is a function of capacity and permit conditions, not staffing.
This Industry Pays Well Above the Service Average
Average annual pay per employee reached $91,919 in 2024, up from $82,214 in 2022, a rise of 11.8%. Payroll took 25.9% of revenue, against 27.3% in 2022.

These are technical and licensed roles: certified operators, chemists, health and safety officers, commercial drivers with hazardous endorsements, engineers and compliance staff. The pay level is a barrier to entry in itself, because the staff a new facility needs cannot be hired cheaply or trained quickly.
Partnerships Run the Large Operations
Sorted by legal form, the industry splits in a way that no other structural cut reveals.


Partnerships are one site in ten but more than a third of the employment and 44.6% of the payroll. They average 113 employees per site, four times the C-corporation average, and pay $103,187 a head against $70,594.

Three-Quarters of Sites Have Fewer Than 20 Employees
Of the establishments whose size band is published, 73.7% have fewer than 20 employees and 40.5% have fewer than five. At the other end, the 10.0% of sites with 50 or more employees hold 55.3% of the employment in those bands.

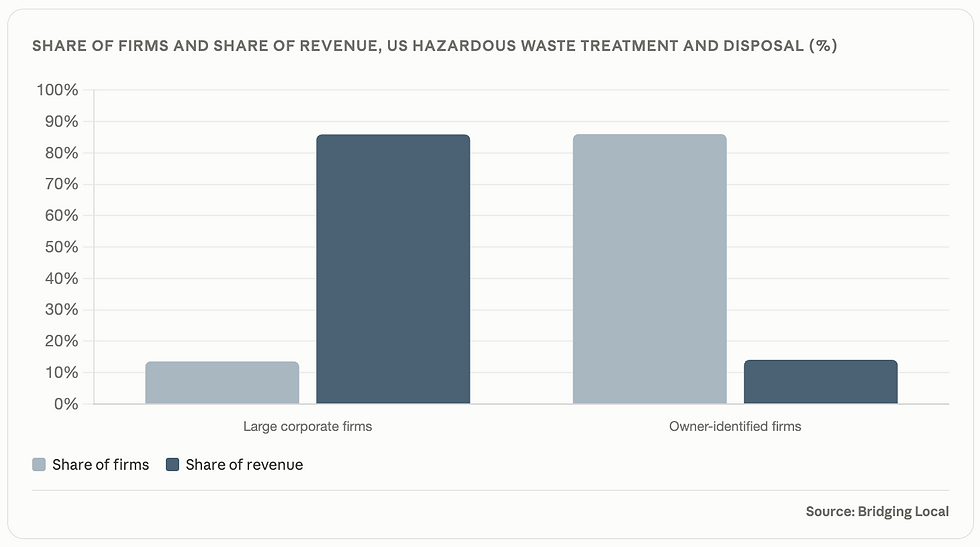
33 Firms Hold 85.9% of the Revenue
The ownership survey makes the concentration explicit. Of 242 employer firms, 208 resolve to identifiable individual owners and 33 do not, the latter being publicly traded companies and large partnerships.
Those 33 firms are 13.6% of the count and 85.9% of the revenue. They average 764 employees each against 22 for the owner-identified firms, and 38.3 times the revenue per firm.
What we do at Bridging Local
We run custom research for businesses that need answers national datasets cannot provide. That means regional demand and generator mapping, competitor and capacity analysis with verified pricing where it can be obtained legitimately, interviews with generators, procurement teams and prime contractors, pipeline analysis for public work, and demand sizing built from the ground up for a specific region or waste stream.
For operators, investors and acquirers, that usually looks like sizing the addressable volume in a defined catchment, understanding competitive gate pricing and remaining capacity, testing a service line with the people who would buy it, or building the evidence a lender, board or acquirer will ask for.
If you are expanding, bidding or investing in hazardous waste services and need evidence, that is the work we do. Custom interviews, competitive and capacity analysis, pipeline research and regional demand sizing, built around your specific decision.
Frequently Asked Questions
How big is the US hazardous waste treatment and disposal market?
The market generated $10.8 billion in revenue in 2024, up 9.9% from $9.9 billion in 2023 and 20.3% above the 2022 level. It employed 30,547 people across 938 establishments and paid $2.8 billion in wages. On the projection in this report it reaches $15.6 billion by 2030.
How fast is the waste treatment and disposal market growing?
Revenue grew 9.4% in 2023 and 9.9% in 2024, a two-year compound rate of 9.7%. This report projects a declining path averaging 6.3% a year to 2030, on the basis that pricing gains and remediation backlog are finite. Employment over the same two actual years rose just 2.1%.
Who are the customers for hazardous waste services?
Business firms and farms account for 53.0% of revenue and the federal government for 37.2%. Household consumers account for 4.2%, not-for-profit organisations 3.1% and state and local governments 2.5%. Government at all levels is 39.7% of the market, which makes public procurement central to any growth plan in this industry.
What margin does a hazardous waste business run on?
Across the industry, revenue exceeded operating expenses by 17.0% in 2024, up sharply from 10.9% in 2023 as costs rose 2.4% against 9.9% revenue growth. That is before interest, income tax, owner compensation and the cost of capital on permitted assets, so net profit is lower.
How concentrated is the hazardous waste industry?
Very. Of 242 employer firms, 33 are large corporate entities holding 85.9% of all revenue, averaging 764 employees each against 22 for the rest. Measured per firm they are 38.3 times the scale. At the same time, 73.7% of individual sites have fewer than 20 employees.
Why are partnerships so prominent in this industry?
Partnerships are only 10.1% of sites but 35.5% of employment and 44.6% of payroll, averaging 113 employees per site and $103,187 in pay. The pattern reflects the joint ventures and limited partnerships formed to bid and deliver large federal site remediation and management contracts, which are staffed heavily and for the duration of the contract.
What does the average hazardous waste job pay?
Average annual pay per employee was $91,919 in 2024, up 11.8% from $82,214 in 2022. The level reflects the licensed and technical nature of the work, from certified facility operators and chemists to hazardous-endorsed drivers, engineers and compliance staff. Payroll took 25.9% of industry revenue.
About This Analysis
This analysis was produced by Bridging Local (RC Research & Insights Inc.), a Vancouver-based market research and business consulting firm. We run primary research across B2B and B2C markets, including surveys, in-depth interviews, competitive analysis, local market deep dives and go-to-market strategy.
If you are sizing a market, testing a concept, or working out where demand sits in your category, our market research services are built for exactly that.


