Fitness Center Market Outlook: US Market Size and Projections to 2030

US fitness and recreational sports centers generated $43.6 billion in revenue in 2024, up 9.9% on 2023 and 20.9% on 2022.
The industry employed 746,840 people and paid $13.6 billion in wages. On the projection set out below it reaches $61.8 billion by 2030.
Revenue was $43.6 billion in 2024, $39.6 billion in 2023, $36.0 billion in 2022 and $33.0 billion in 2017. Payroll was $13.6 billion.
Between 2017 and 2022 the market added $3.0 billion. Between 2022 and 2024 it added $7.5 billion. The 2017 to 2022 period covers the closure of facilities during the pandemic and the partial reopening that followed.


Growth Has Run at 4.0% a Year Since 2017
The data supports three annual growth rates over different periods.
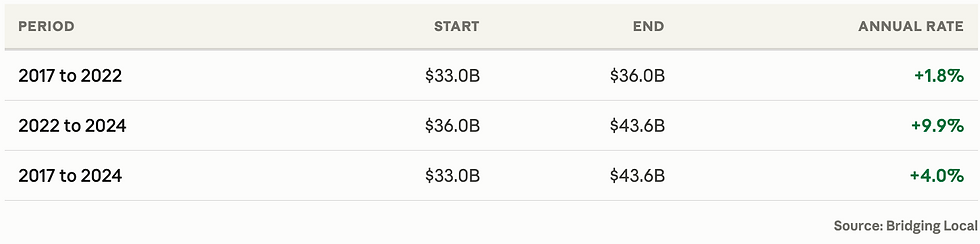
The 1.8% rate is held down by the closure period. The 9.9% rate is lifted by the recovery from those closures. The 4.0% seven-year rate covers both periods and is the rate used as the reference point for the projection below.

The Market Reaches $61.8 Billion by 2030
On the projection used here the market adds $18.2 billion over six years at a 6.0% compound annual rate.

The Market Reaches $61.8 Billion by 2030
On the projection used here the market adds $18.2 billion over six years at a 6.0% compound annual rate.

The rate declines each year, from 8.0% in 2025 to 4.5% in 2030. The recovery volume that produced two years of near 10% growth is finite, and the drivers that remain are population growth, membership pricing and the continuing shift of household spending toward health services.
Commercial Operators Hold 81.7% of the Market
Commercial operators produced $35.6 billion in 2024. Tax-exempt operators produced $8.0 billion, 18.3%. The exempt group covers YMCAs, municipal and university recreation centres and community sports clubs.

Commercial revenue rose 11.1% in 2024 and exempt revenue rose 4.9%. The exempt share of the market fell from 19.1% to 18.3% over the year.
Commercial operators set their own prices and can add membership tiers, personal training and other paid services. Municipal and university facilities work to budgets set elsewhere and under a mandate to keep access affordable, which limits how much of a cost increase they can pass on.
Costs Rose 3.8% While Revenue Rose 9.9%
Operating expenses were $38.3 billion in 2024 against $36.9 billion in 2023.

Revenue exceeded operating expenses by 12.1% in 2024 and by 7.0% in 2023. In dollars the difference moved from $2.8 billion to $5.3 billion.

These figures are measured before interest, income tax and owner compensation, so the 12.1% figure is not a net profit margin. Commercial operators spent 86.6% of revenue on operations in 2024 and exempt operators spent 93.6%.

Revenue Per Employee Reached $58,325
Employment in 2024 was 746,840 against 745,788 in 2017, a rise of 0.1%. Revenue over the same seven years rose 31.8%.


Revenue per employee moved from $44,304 to $58,325, an increase of 31.6% at a 4.0% annual rate. Part of that is membership pricing. The rest reflects staffing changes across the industry: keypad and app-based entry, self-service check-in, 24-hour access models that operate without a staffed front desk, and group class formats that serve more members per instructor.
Commercial operators generated $65,973 per employee in 2024 and exempt operators $38,407. Exempt operators hold 27.7% of industry employment and 18.3% of revenue.
Payroll Holds at 31.2% of Revenue
Payroll took 31.2% of revenue in 2024, 31.7% in 2022 and 32.0% in 2017.
Average annual pay per employee was $18,189 in 2024, against $16,489 in 2022 and $14,163 in 2017, an increase of 28.4% across the period. The absolute level is low because much of the workforce is part-time: instructors teaching a small number of classes each week, weekend lifeguards and student front-desk staff.

31,581 Firms Run 38,998 Locations
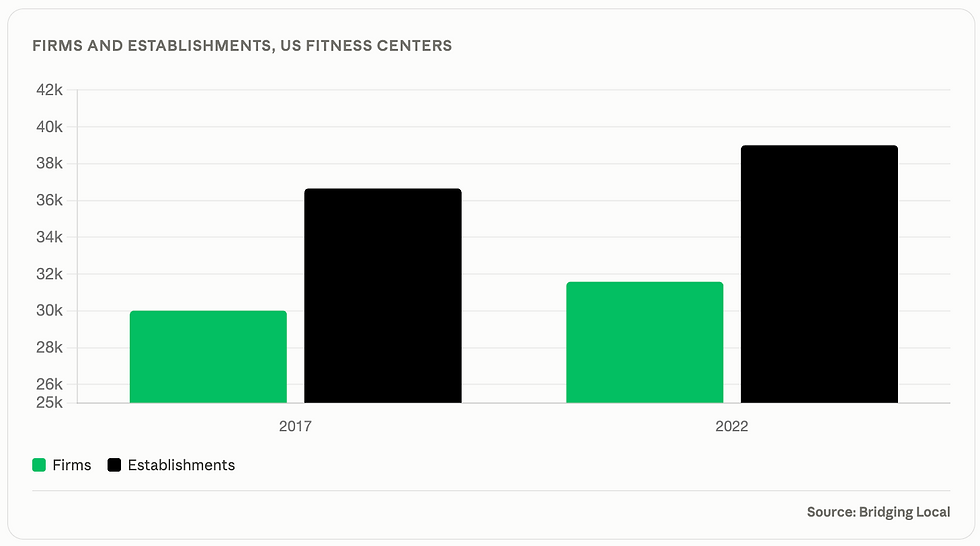
Between 2017 and 2022 the number of firms rose from 30,013 to 31,581, up 5.2%. The number of establishments rose from 36,655 to 38,998, up 6.4%. Establishments per firm moved from 1.22 to 1.23.
Revenue per establishment rose from $901,415 to $924,209 over the same period. In 2022, exempt establishments averaged $1,655,938 in revenue each against $836,599 for commercial establishments.
The difference in site size reflects different property models. A YMCA or university recreation complex is a single large building with a pool, courts, a weight floor and programme rooms. A commercial operator more often runs a studio of a few thousand square feet in a retail unit.
One Operator in Ten Holds 46.1% of Revenue
In the ownership survey, 27,179 of 30,297 employer firms resolve to identifiable individual owners. The remaining 3,118 do not, and are mainly publicly traded companies and large partnerships.
Those 3,118 firms are 10.3% of the count and 46.1% of the revenue. Average revenue among them was $5,095,227, against $682,343 for the 27,179 owner-identified firms.

For competitive analysis the relevant figure is that around one operator in ten is a large corporate entity holding close to half of industry revenue. The remaining nine-tenths are owner-operated businesses sharing the other half.
Female-Owned Firms Are 26.9% of Operators and 17.2% of Revenue
Among the 27,179 firms whose ownership is classifiable, the split by owner is as follows.


Average revenue per female-owned firm was $435,307 against $836,720 for male-owned firms. The difference sits in business size rather than in the number of businesses.
Looking for Detailed Custom Market Research?
We run custom research for businesses that need answers national datasets cannot provide. For fitness operators that covers trade area definition and member catchment sizing, competitor mapping with verified pricing and capacity, a site recommendation ranked against alternatives, format and positioning guidance, revenue modelling to break-even, and a go-to-market plan for pre-sale and launch.
For operators, franchisees and investors, that usually means sizing the addressable membership base in a defined area, understanding competitive pricing and retention, testing a format with the people who would buy it, or building the evidence a lender or board will ask for.
Frequently Asked Questions
How big is the US fitness center market?
US fitness and recreational sports centers generated $43.6 billion in revenue in 2024, up 9.9% from $39.6 billion in 2023. The industry employed 746,840 people and paid $13.6 billion in wages. On the projection in this report it reaches $61.8 billion by 2030.
What growth rate should I use to model a new gym?
The seven-year rate of 4.0% covers both the closure period and the recovery, which makes it the most stable reference point in the data. The recent 9.9% rate is a recovery rate. This report uses a declining path averaging 6.0% a year to 2030, between the two.
What margin does a fitness center run on?
Across the industry, revenue exceeded operating expenses by 12.1% in 2024 and 7.0% in 2023. The figure is measured before interest, income tax and owner compensation, so net profit is lower. Commercial operators spent 86.6% of revenue on operations and tax-exempt operators spent 93.6%.
How concentrated is the fitness industry?
Large corporate operators that cannot be classified by individual ownership are 10.3% of firms and 46.1% of revenue, averaging $5.1 million each against $682,343 for owner-operated firms. The remaining nine-tenths of operators share roughly half the revenue.
Is fitness industry employment growing?
Employment in 2024 was 746,840, 0.1% above the 2017 level, while revenue rose 31.8% over the same seven years. Revenue per employee moved from $44,304 to $58,325.
How much of the market is non-profit?
Tax-exempt operators produced $8.0 billion in 2024, 18.3% of revenue, down from 19.1% in 2023. They hold 27.7% of industry employment, and their individual sites average roughly twice the revenue of commercial sites.
About This Analysis
This analysis was produced by Bridging Local (RC Research & Insights Inc.), a Vancouver-based market research and business consulting firm. We run primary research across B2B and B2C markets, including surveys, in-depth interviews, competitive analysis, local market deep dives and go-to-market strategy.
If you are sizing a market, testing a concept, or working out where demand sits in your category, our market research services are built for exactly that.