US Mental Health Clinic Market Outlook 2026: Market Size and Projections to 2030

The US outpatient mental health and substance abuse clinic market reaches an estimated $39.9 billion in 2026 and $52.2 billion by 2030. Nearly half of every revenue dollar goes to payroll, and seven in ten clinics now bill for telehealth.
US outpatient mental health and substance abuse clinics took in $32.6 billion in 2023, up from $21.8 billion in 2017. Over those six years the number of firms in the industry rose 46.4% and the number of clinic sites rose 32.5%.
The market reaches an estimated $39.9 billion in 2026 and $52.2 billion by 2030 if that growth rate holds.
Two structural facts sit behind those numbers. Payroll absorbs 47.0% of revenue, the highest labour share of any service industry of comparable size. And 56.4% of revenue runs through nonprofit organisations, while almost all the growth in clinic count is coming from for-profit operators.
Figures in this article cover NAICS 621420, outpatient mental health and substance abuse centers. All data in this article has been personally verified by Bridging Local analysts.
The US Mental Health Clinic Market Reaches $39.9 Billion in 2026
The market was worth $32.6 billion in 2023, the most recent year with published revenue, and reaches an estimated $39.9 billion in 2026.


Solo practices without employees are a negligible part of this industry, at 1,000 firms and $150.6 million in 2023, under 0.5% of revenue. Unlike most service categories, mental health clinic revenue is almost entirely generated by organisations with paid staff.
Revenue Has Grown 6.9% a Year Since 2017
Clinic revenue rose from $21.7 billion in 2017 to $30.6 billion in 2022, then to $32.5 billion in 2023. That is a compound rate of 6.9% a year across the six years, with 6.0% in the most recent year.

Growth in the number of businesses has been faster than growth in revenue. Firms rose from 6,588 to 9,647 between 2017 and 2022, up 46.4%, at a compound rate of 7.9% a year. Clinic sites rose from 12,061 to 15,976, up 32.5%, at 5.8% a year.

More firms entered than revenue expanded to support, which means average revenue per firm fell. In 2017 the average firm generated $3.29 million. By 2022 that had dropped to $3.18 million.
What a falling average per firm indicates. The industry is growing and fragmenting at the same time. New entrants are arriving faster than the revenue pool is expanding, which puts downward pressure on the average operator even while the category headline looks strong. Anyone entering on the strength of a 6.9% market growth rate is entering a market where the number of competitors has been growing at 7.9%.
Mental Health Clinic Market Forecast to 2030
The forecast projects the 2017 to 2023 compound growth rate of 6.9% a year forward from 2023. On that rate the market reaches $39.9 billion in 2026 and $52.2 billion in 2030.


The market adds $19.6 billion between 2023 and 2030, an average of $2.8 billion a year. Clinic sites are projected to rise from 16,815 to 24,924 over the same period on the 5.8% annual rate observed between 2017 and 2022.
Payroll Takes 47.0% of Clinic Revenue
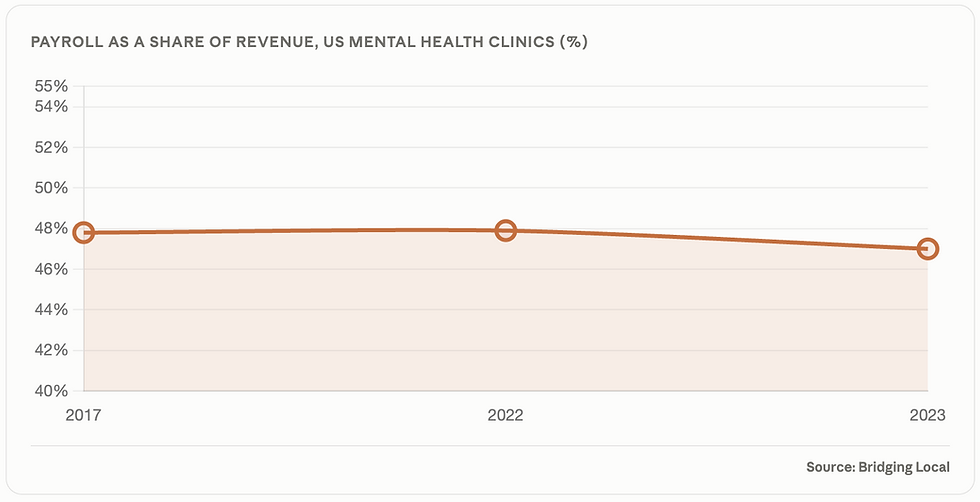
US mental health clinics paid $15.2 billion in wages in 2023 against $32.5 billion in revenue. That is 47.0% of every dollar taken in, and the share has held near 48% since 2017.

Total operating expenses in 2023 were $29.2 billion, 90.0% of revenue. Payroll was 52.2% of those expenses. The gap between revenue and operating expenses was 10.0%.
"Clinical labour is not one cost line among many in this industry. It is roughly half the business, and it is the constraint on how fast any operator can grow."
Average pay per employee rose from $38,286 in 2017 to $51,938 in 2023, an increase of 35.7%. These averages divide total payroll across all staff, clinical and administrative, full-time and part-time, so they are not a clinician salary.
Why the payroll share matters more here than elsewhere. At 47% of revenue, a clinic cannot absorb wage increases through efficiency the way a capital-intensive business can. Capacity is set by how many licensed clinicians are on staff and how many hours they bill. Growth requires hiring, and hiring is limited by clinician supply rather than by demand or capital.
Employment Fell 3.6% in 2023 While Revenue Rose 6.0%
Clinic employment fell from 304,474 in 2022 to 293,545 in 2023, a decline of 10,929 people. Revenue rose 6.0% over the same year.

Revenue per employee jumped from $100,626 to $110,592, an increase of 9.9% in a single year. Average pay rose 7.8% over the same period. Clinics generated more revenue from fewer staff.

69.9% of Clinics Bill for Telehealth, Ranging From 43.3% to 90.1% by State
Of the 15,976 US mental health clinic sites reporting in 2022, 11,173 recorded revenue from telemedicine services. That is 69.9% of clinics, generating 67.0% of industry revenue and employing 67.7% of the workforce.

Clinics offering telehealth average $1.84 million in revenue each. Clinics that do not average $2.10 million. The larger clinics are, on average, the ones that have not adopted it.

Nebraska leads at 90.1% of clinics, followed by Alaska at 89.3%, North Dakota at 88.6% and Virginia at 88.4%. At the other end, Alabama sits at 43.3%, Louisiana at 45.5% and Missouri at 49.0%. The spread between the highest and lowest state is 46.8 percentage points.

California is the largest state market at 1,567 clinic sites and $3.1 billion in revenue, and sits well below the national average on telehealth at 55.0% of clinics and 47.3% of revenue. New York, the second largest at 711 sites, sits well above at 86.4%.
Visits and consultations account for 88.9% of clinic service revenue, with non-surgical interventions at 4.9% and other patient care services at 5.2%. Laboratory and diagnostic imaging together account for 1.0%. This is a consultation business almost end to end, which is why telehealth applies to so much of it.
Nonprofits Are 22.9% of Firms and 56.4% of Revenue
Tax-exempt organisations ran 2,213 of the 9,647 firms in the industry in 2022 and generated $17.3 billion of the $30.6 billion in revenue.


The average nonprofit clinic site generates $2.7 million, against $1.4 million for the average for-profit site. Nonprofits run fewer, larger clinics.
Growth in clinic count is almost entirely for-profit


Between 2021 and 2023 the industry added 2,354 clinic sites. Nonprofits accounted for 62 of them. C-corporations grew 39.3%, S-corporations 32.4% and partnerships 28.8%.
Nonprofits still employ 60.9% of the workforce from 38.3% of the sites. For-profit entrants are opening smaller clinics in larger numbers.
Multi-Site Operators Hold 68.5% of Market Revenue
Firms operating more than one clinic accounted for 1,711 of 9,647 firms in 2022, 17.7% of the total. They held 8,040 of 15,976 clinic sites and $21.0 billion of $30.6 billion in revenue.

Multi-site firms average 4.7 clinics each. At the top of the market, 34 firms operate 25 or more clinics. That is 0.4% of firms, running 1,895 sites and generating $3.7 billion, 12.1% of industry revenue.

By employment, firms with 100 or more staff generated $19.0 billion, 62.9% of revenue from firms operating the full year. Firms with fewer than 20 staff generated 12.7%.
Women Own 49.4% of Privately Held Clinics and Earn 31.0% of the Revenue
Among privately held clinic firms whose ownership is classifiable, women own 3,358 of 6,793, or 49.4%. Those firms generate $2.9 billion of $9.5 billion in classifiable revenue, or 31.0%.


Women own nearly half of privately held clinic firms in this industry, a far higher share than in most service categories. Male-owned firms generate $1.97 million each on average against $875,000 for female-owned firms, a gap of 2.2 times.
Where This Data Stops and Custom Research Begins
National figures cover nonprofit community centres and private therapy groups under one heading, mix cash-pay and insurance-funded models together, and average across fifty state regulatory environments.
The questions that follow usually need primary research. What referral sources in a specific area actually send patients where, and why. What payer mix and reimbursement rates a new clinic can realistically expect locally. What wage and caseload it takes to recruit and retain licensed clinicians in a given market. Whether a service line, location or delivery model has demand behind it before capital is committed.
What we do at Bridging Local
We run custom research for businesses that need answers national datasets cannot provide. That means local market deep dives, competitor and referral mapping, interviews with clinicians, administrators and referral partners, surveys of the population you intend to serve, and market sizing built from the ground up for a specific catchment rather than scaled down from national totals.
For clinic operators, healthcare investors and organisations expanding behavioural health services, that usually looks like sizing demand in a defined catchment area, assessing competitive supply and wait times, understanding the local payer and referral landscape, or building the case a lender or board will ask for.
Frequently Asked Questions
How big is the US mental health clinic market in 2026?
The US outpatient mental health and substance abuse clinic market is estimated at $39.9 billion in 2026, up from $32.6 billion in 2023. The 2026 figure is a Bridging Local estimate built by projecting the 2017 to 2023 growth rate of 6.9% a year forward from 2023. An estimated 19,904 clinic sites will be operating in 2026.
What is the behavioural health market forecast to 2030?
The US mental health clinic market is projected at $52.2 billion by 2030, growing at 6.9% a year from $32.6 billion in 2023. That adds $19.6 billion over seven years, an average of $2.8 billion a year. Clinic sites are projected to rise from 16,815 to 24,924 over the same period.
How many mental health clinics are there in the US?
There were 16,815 outpatient mental health and substance abuse clinic sites in the US in 2023, operated by roughly 9,600 firms. The number of firms grew 46.4% between 2017 and 2022 and the number of clinic sites grew 32.5%. A further 1,000 solo practices operate without paid staff, generating under 0.5% of industry revenue.
How many mental health clinics offer telehealth?
69.9% of US mental health clinic sites recorded revenue from telemedicine services in 2022, generating 67.0% of industry revenue. Adoption varies widely by state, from 90.1% of clinics in Nebraska and 89.3% in Alaska down to 45.5% in Louisiana and 43.3% in Alabama. California, the largest state market, sits below the national average at 55.0%.
How much of mental health clinic revenue goes to staff?
Payroll accounted for 47.0% of US mental health clinic revenue in 2023, down slightly from 47.9% in 2022 and 47.8% in 2017. Total operating expenses were 90.0% of revenue, with payroll making up 52.2% of those expenses. Average pay per employee was $51,938 in 2023, an average across clinical and administrative staff rather than a clinician salary.
Are mental health clinics mostly nonprofit or for-profit?
Both, in different proportions. Nonprofits ran 22.9% of firms in 2022 but generated 56.4% of revenue, operating larger clinics averaging $2.7 million each against $1.4 million for for-profit sites. Growth is almost entirely for-profit: between 2021 and 2023 the industry added 2,354 clinic sites, of which nonprofits accounted for 62. C-corporation sites grew 39.3% and S-corporation sites 32.4% over the same period.
About This Analysis
This analysis was produced by Bridging Local (RC Research & Insights Inc.), a Vancouver-based market research and business consulting firm. We run primary research across B2B and B2C markets, including surveys, in-depth interviews, competitive analysis, local market deep dives and go-to-market strategy.
If you are sizing a market, testing a concept, or working out where demand sits in your category, our market research services are built for exactly that.


Comments