US Pet Food Industry 2026: The Biggest Segment Is Also the Slowest Growing

Pet food and treats reach $69.7 billion in 2026, 43% of all US pet spending. The category is growing at 2.1% while every other part of the industry grows faster. Here is what sits behind that.
Americans spent $158 billion on their pets in 2025. Of that, $68.3 billion went on food and treats, the single largest line in the industry at 43.2% of total spending.
In 2026 that food and treats figure reaches $69.7 billion, an increase of 2.1%. Over the same year veterinary care grows 3.4%, supplies grow 3.5% and pet services grow 4.2%.
The category that takes the most money from pet owners is the one they are increasing their spending on most slowly. For anyone manufacturing, distributing or retailing pet food, that gap defines the commercial problem.
Figures in this article cover the United States and are drawn from pet industry expenditure data and the 2025 National Pet Owners Survey, as cited in the 2026 State of the Industry Report. Segment shares, per-household figures and growth rates not stated in the source are calculated by Bridging Local from the reported values.
US Pet Food and Treats Reach $69.7 Billion in 2026
Pet food and treats generated $68.3 billion in US sales in 2025 and are projected at $69.7 billion in 2026. The category sits inside a total pet industry of $158 billion in 2025, projected at $165 billion in 2026.


Other services covers boarding, grooming, insurance, training, pet sitting, pet walking and everything outside veterinary care.
Pet Food Is the Largest Segment and the Slowest Growing
Ranking the four segments by growth rate produces the exact inverse of ranking them by size.
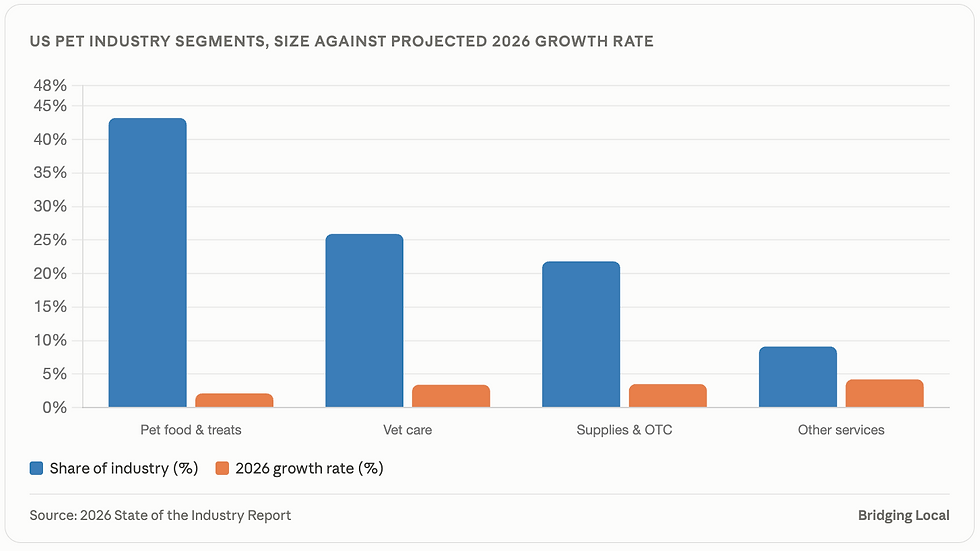
Other services is the smallest segment at 9.1% and the fastest growing at 4.2%. Pet food is the largest at 43.2% and the slowest at 2.1%. Supplies and vet care sit in between on both measures.
In dollar terms the picture is less stark. Pet food adds $1.4 billion in 2026, matching veterinary care and ahead of supplies at $1.2 billion and services at $0.6 billion. A low growth rate on a large base still produces meaningful absolute volume.
"Food takes the largest share of every pet owner's budget and is claiming the smallest share of the increase."
Industry Growth Has Settled at Roughly 4% After the Pandemic Surge
Total US pet industry spending rose from $91 billion in 2018 to $158 billion in 2025, an increase of 73.6% in seven years at a compound rate of 8.2%. That average conceals three distinct periods.


The industry added $34 billion in the two years to 2022 and $21 billion in the three years since. Annual growth peaked at 20.4% in 2021, fell to 3.4% by 2024, and has run between 3.4% and 4.4% every year since.

The current rate is below the pre-pandemic run rate of 6.4%. The industry has not returned to its 2018 to 2020 trajectory, it has settled below it.
95 Million US Households Own a Pet and 71 Million Own a Dog
Ninety-five million US households own at least one pet. Dogs are in 71 million of them and cats in 53 million.


The species figures total 152 million against 95 million pet-owning households, because households own more than one kind of animal. Dog and cat households alone total 124 million, which means a large share of US pet owners keep both.
Why dog and cat concentration matters for food. Dogs and cats account for 124 million of the 152 million species-level ownership counts, roughly 82%. Every other species combined represents 28 million. For a pet food business, the addressable market is effectively two animals, and dog households outnumber cat households by 18 million.
Pet-Owning Households Spend $719 a Year on Food and Treats
Dividing 2025 spending across 95 million pet-owning households gives an average of $1,663 per household across the full industry, of which $719 goes on food and treats.

Veterinary care takes $432 per household, supplies and over-the-counter medicine $362, and services $151. In 2026 the food and treats figure rises to $734 on the same household base, an increase of roughly $15 a year.

These are averages across all pet-owning households, including those keeping only fish or a small animal. Households with multiple dogs will sit well above them and single-fish households well below. The figures are useful for scale rather than for segmentation.
Millennials and Gen Z Account for 51% of US Pet Owners
Millennials are the largest single group of US pet owners at 30%, followed by Gen X at 28%, Boomers at 22% and Gen Z at 21%.

Millennials and Gen Z together account for 51% of pet owners. Gen Z at 21% is within one percentage point of Boomers at 22% despite being at a much earlier stage of household formation and income.
The generational split is close to even, and that is the finding. No generation holds more than 30% and none holds less than 21%. Pet ownership is not concentrated in one cohort the way many consumer categories are. A pet food brand building around a single generational identity is addressing at most three in ten owners and excluding the other seven.
Services Is the Fastest Growing Segment From the Smallest Base
Other services reaches $14.9 billion in 2026, up 4.2%, the fastest growth of the four segments. It covers boarding, grooming, insurance, training, pet sitting and walking.
At 9.1% of industry spending it is also the smallest segment by a wide margin, generating less than a quarter of what pet food generates. Its $0.6 billion of 2026 growth is the smallest dollar contribution of the four.

Percentage growth and dollar growth rank differently here. Services grows twice as fast as food and adds less than half as much money. For an operator deciding where to allocate capital, the two rankings point in opposite directions and the right answer depends on whether the goal is share of a growing niche or volume in a large one.
Looking for custom market research for your petcare business?
The North American petcare market continues to create opportunities as pet ownership and spending on pets grow. Whether you are launching a new product, entering a new category, expanding into a new market, or looking to understand why a product is not performing as expected, the right research can help you make a more informed decision.
We conduct custom market research at both national and local levels, focused on your specific petcare segment. Our research can help you understand market demand, identify growth opportunities, assess competitors, size a category or geographic market, and determine how to position your business for market entry or expansion.
We combine primary and secondary research to get beyond broad industry statistics and focus on the questions that matter to your business. For pet food manufacturers, retailers, service operators, and petcare brands, this could mean testing a new product or price point with real pet owners before launch, measuring demand in a specific category or region, mapping competitors targeting the same customers, or understanding what is affecting sales performance.
If you are working through a specific decision in the petcare industry and need evidence rather than assumptions, we can help. Custom surveys, in-depth interviews, competitive analysis, category research, local market analysis, and other research methods are built around your specific business question. Contact us here to get started.
Frequently Asked Questions
How big is the US pet food market in 2026?
US pet food and treats are projected at $69.7 billion in 2026, up from $68.3 billion in 2025, growth of 2.1%. The category represents 43.2% of total US pet industry spending, making it the largest of the four segments. The total pet industry is projected at $165 billion in 2026, up from $158 billion in 2025.
How much do Americans spend on their pets each year?
Americans spent $158 billion on pets in 2025, projected to reach $165 billion in 2026. Across 95 million pet-owning households that averages $1,663 per household in 2025, of which $719 goes on food and treats, $432 on veterinary care, $362 on supplies and over-the-counter medicine, and $151 on services such as boarding, grooming and training.
How many US households own a pet?
Ninety-five million US households own at least one pet. Dogs are in 71 million households, 74.7% of pet-owning homes, and cats in 53 million, 55.8%. Freshwater fish follow at 9 million, reptiles at 6 million, birds and small animals at 5 million each, horses at 2 million and saltwater fish at 1 million. The species counts total more than 95 million because households commonly own more than one type of animal.
Which generation owns the most pets in the US?
Millennials are the largest group at 30% of US pet owners, followed by Gen X at 28%, Boomers at 22% and Gen Z at 21%. Millennials and Gen Z together account for 51%. The distribution is unusually even for a consumer category, with no generation above 30% or below 21%.
Is the US pet industry still growing fast?
Growth has slowed considerably. The industry grew at 6.4% a year between 2018 and 2020, surged to 15.3% between 2020 and 2022, then settled at 4.9% between 2022 and 2025. Annual growth peaked at 20.4% in 2021 and has run between 3.4% and 4.4% since 2024. The current rate sits below the pre-pandemic run rate rather than having returned to it.
Which pet industry segment is growing fastest?
Other services, covering boarding, grooming, insurance, training, pet sitting and walking, is projected to grow 4.2% in 2026, the fastest of the four segments. Supplies and over-the-counter medicine follow at 3.5%, veterinary care at 3.4% and pet food and treats at 2.1%. In dollar terms the ranking reverses: food and vet care each add $1.4 billion while services adds $0.6 billion.
About This Analysis
This analysis was produced by Bridging Local (RC Research & Insights Inc.), a Vancouver-based market research and business consulting firm, using published US pet industry expenditure and pet owner survey data. We run primary research across B2B and B2C markets, including surveys, in-depth interviews, competitive analysis, category deep dives and go-to-market strategy.
If you are sizing a market, testing a concept, or working out where demand sits in your category, our market research services are built for exactly that.


