US Protein Market 2026: The Protein Label Is Growing Faster Than Protein Itself

America's $54.3 billion processed meat category grew 0.1% last year. Products marketed on a high protein claim grew 3.6% to $24.0 billion, and 24.9% over four years. The fastest growth inside that is in chocolate, ice cream and pastries.
In 2025, Americans spent $54.3 billion on processed meat, seafood and meat alternatives. That category grew by 0.1%. Over the same year they spent $24.0 billion on packaged foods carrying a high protein claim, and that spending grew 3.6%.
Within the high protein group, processed meat and seafood products specifically grew at a compound rate of 8.3% over four years, reaching $2.03 billion. The wider processed meat category they sit inside grew 0.3%.
Protein consumption in the United States is not rising quickly. Protein as a selling proposition is. For anyone making, buying or selling food, those are two different markets with two different growth rates.
Figures in this article cover the United States, drawn from market data published through Agriculture and Agri-Food Canada covering 2021 to 2025 with forecasts to 2029 and 2030. Trade figures cover protein ingredient imports through 2025.
The $54.3 Billion US Processed Meat Category Grew 0.1% in 2025
Processed meat, seafood and alternatives to meat reached $54.3 billion in retail value in the United States in 2025, an increase of 0.1% in current terms. High prices and health concerns constrained the category.


Processed meat was the only segment to grow. Beef and veal at 7.2 million tonnes was the best performing product area. Tyson Foods held the leading position with a 13% retail value share. The category is forecast to reach $63.3 billion by 2030, a compound rate of 3%.

High Protein Products Reached $24.0 Billion and Grew 24.9% in Four Years
Packaged foods carrying a high protein claim generated $24.0 billion in US retail sales in 2025, up 3.6% on the year and 24.9% since 2021, a compound rate of 5.7%.

Four categories carry almost all of it. Snacks lead at $7.42 billion and 31.0% of the total, followed by dairy and alternatives at $7.30 billion and 30.4%, cooking ingredients and meals at $5.06 billion and 21.1%, and staple foods at $4.19 billion and 17.5%. Hot and cold drinks account for $124.9 million, under 1%.


Within dairy, high protein yogurt accounts for 15.6% of all high protein sales and drinking milk products 7.8%. Within snacks, meat snacks account for 12.7% and snack bars 10%. Within cooking and meals, ready meals account for 15% and pizzas 4%.
Protein-Labelled Processed Meat Grew 8.3% While the Category Was Flat
The clearest illustration of the split sits inside the meat category itself. Processed meat, seafood and alternatives carrying a high protein claim generated $2.03 billion in 2025, growing at a compound rate of 8.3% since 2021 and 37.8% in total.
The full processed meat, seafood and alternatives category, worth $54.3 billion, grew 0.1% in 2025 and its largest segment grew 0.3%.

Protein-labelled processed meat represents 3.7% of the total processed meat category by value. It is small, and it is growing at more than twenty times the rate of the category around it.
The Fastest Growth Is in Chocolate, Ice Cream and Pastries
Ranking the high protein sub-categories by compound growth from 2021 to 2025 produces a list that has little to do with traditional protein foods.
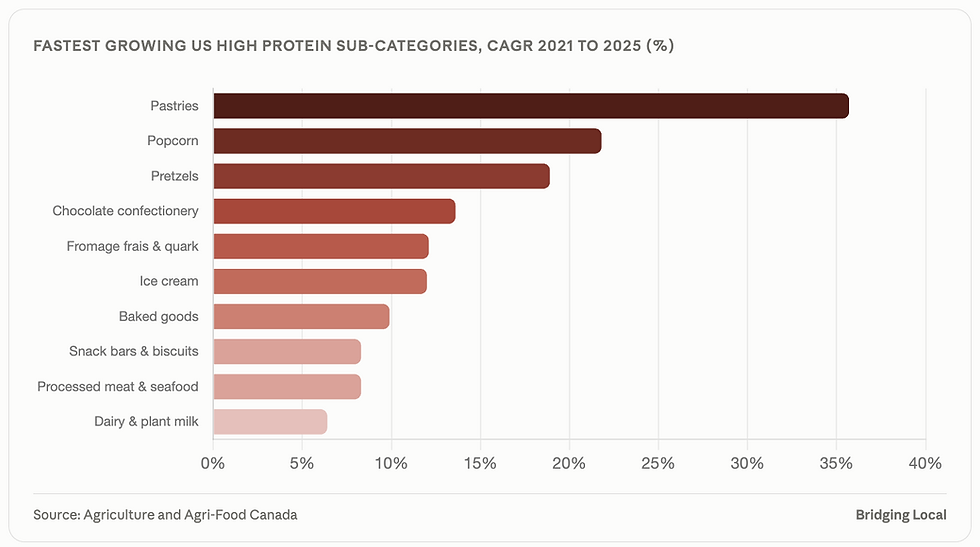
High protein pastries grew at 35.7% compound, popcorn at 21.8%, pretzels at 18.9%, chocolate confectionery at 13.6% and fromage frais and quark at 12.1%. Within the reported category table, chocolate confectionery grew 66.7% in total over four years and ice cream 57.3%.
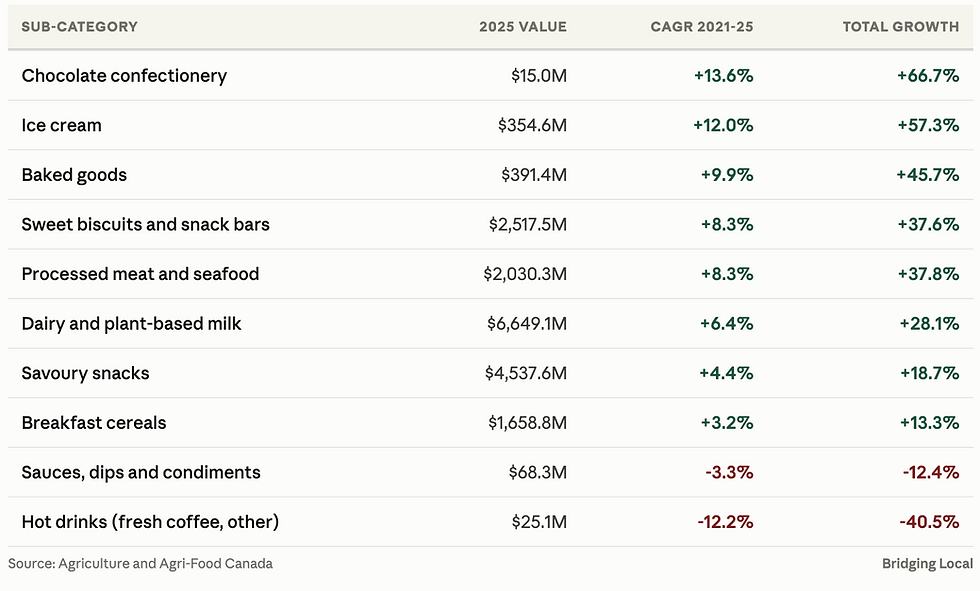
Two things are worth separating here. Chocolate confectionery at $15.0 million and pastries are growing from very small bases, so high percentages translate into modest dollar amounts. Sweet biscuits and snack bars at $2.52 billion growing 8.3% is a far larger commercial movement than chocolate confectionery growing 13.6%.
Meat Substitutes and Tofu Both Declined in 2025
Meat and seafood substitutes fell 0.6% to $1.6 billion in 2025. Tofu and derivatives fell 1.1% to $243.4 million. Both declined in volume as well as value, despite promotional activity aimed at lowering prices to stimulate demand.
Category momentum in US plant-based eating has cooled from its 2020 peak. The majority of American consumers describe their diet as omnivore or carnivore, and meat-free lifestyles remain a niche. Plant-based protein purchases function more as complementary usage than as replacement for animal products.

Combined, meat substitutes and tofu account for 3.4% of the processed meat, seafood and alternatives category. Taste, texture and cost remain the barriers determining whether consumers choose meat or a substitute.
A complementary category rather than a substitute one. Consumers buying plant-based protein are largely adding it alongside animal protein rather than replacing it. That framing changes the addressable market: the competitor is not the meat counter, it is the other items in a mixed weekly basket, and the benchmark for taste and price is set by what the same shopper is already buying.
High Protein Drinks Are Forecast to Grow 61% by 2029
High protein hot and cold drinks were worth $124.9 million in 2025, the smallest category in the dataset. They are forecast to reach $200.8 million by 2029, growth of 60.8% and the fastest of any category.
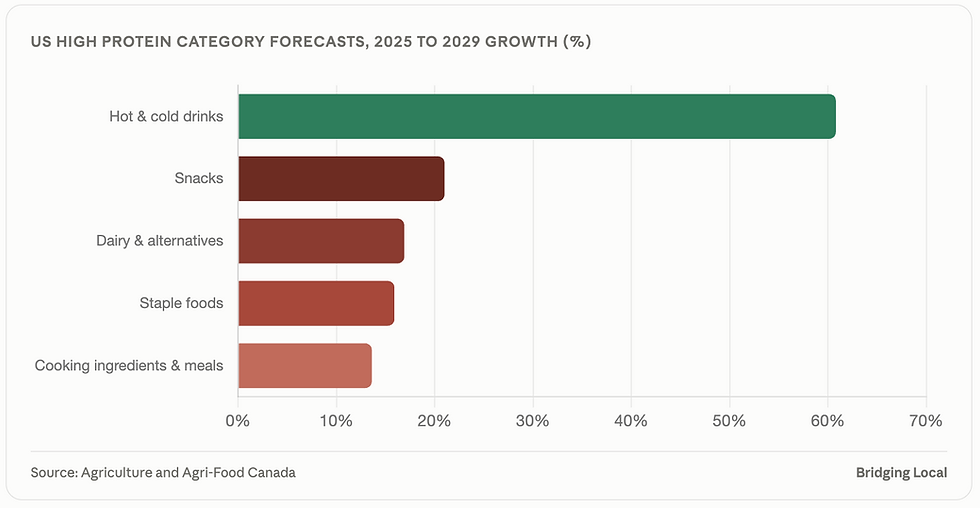
Inside that, high protein soft drinks including carbonates, juice, ready-to-drink coffee, energy and sports drinks are forecast to grow 79.1%, from $99.8 million to $178.7 million. High protein hot drinks are the only category forecast to decline, falling 12.0% from $25.1 million to $22.1 million after already losing 40.5% between 2021 and 2025.
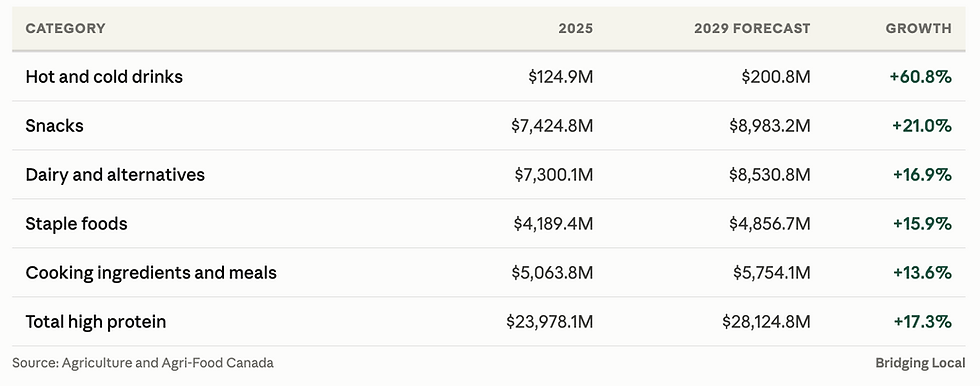
Snacks are forecast to add $1.56 billion by 2029, more than any other category in dollar terms and roughly twenty times what drinks will add. The drinks category grows fastest and matters least by volume of revenue.
Confectionery Uses More Animal Protein Than Meat Products Do
The United States consumed 225.0 thousand tonnes of animal-derived protein ingredients in 2025, forecast to reach 237.7 thousand tonnes by 2029 at a compound rate of 1.4%. Gelatin accounts for 32.1% of that volume and caseinates 30.9%, together nearly two thirds of the total.

By application, confectionery is the single largest use at 55,560 tonnes and 24.7% of volume. Baked goods follow at 45,510 tonnes and 20.2%. Yogurt and sour milk account for 21,466 tonnes and 9.5%.
Processed meat and alternatives to meat use 5,668 tonnes, 2.5% of the total. That category fell at a compound rate of 5.8% between 2021 and 2025, the steepest decline of any application in the dataset.
Ready-to-drink coffee and malt-based hot drinks was the fastest growing application at 4.3% compound between 2021 and 2025, reaching 10,237 tonnes, and is forecast to continue at 3.1% to 2029. Cheese fell 3.5% compound and baby food and milk formula 2.7%.
Where animal protein ingredients actually go. Gelatin in confectionery and caseinates in baked goods and dairy account for the bulk of US animal protein ingredient demand. Protein positioning in these products is often incidental to their function: gelatin is there for texture in a gummy, not for a protein claim. Ingredient volume and protein marketing are not the same market.
US Protein Ingredient Imports Fell 30% From Their 2022 Peak
The United States imported $2.10 billion of protein ingredients in 2025, totalling 476,581 tonnes. That is down from a peak of $3.01 billion in 2022, a decline of 30.1% in value and 23.0% in volume.

New Zealand is the largest supplier by value at $283.1 million and 13.5% share, followed by Canada at $250.8 million and 11.9% and Denmark at $204.6 million and 9.7%. By volume the ranking differs: Australia leads at 108,908 tonnes, followed by Canada at 78,590 tonnes and China at 59,046 tonnes.
Denmark and Brazil gained share while China and Germany lost it

Denmark grew at 18.4% compound and Brazil at 15.4%, the only two of the top ten to record meaningful growth in a declining import market. Germany fell 13.3%, China 12.9% and France 10.1%. Canada, the second largest supplier, declined 1.6% by value and 4.6% by volume.
Whey and egg albumin grew while casein and wheat gluten fell

Protein concentrates and textured protein substances fell fastest at 15.3% compound, which aligns with the decline in meat substitute sales over the same period. Milk albumin and whey proteins grew 19.0% and 13.9%, consistent with growth in high protein dairy and snack formats.
Price Sensitivity Is Shaping What Gets Tried and What Gets Bought
Fifty-three percent of US protein buyers say inflation has made them less likely to try new foods. Forty-eight percent say they avoid items that are too expensive.
Those two figures set the commercial constraint around everything above. A category growing on a protein claim is also a category where the claim usually carries a price premium, and roughly half the buyer base is actively screening against premium pricing.

Shelf-stable and frozen protein formats are gaining relevance as a result, valued for keeping households stocked longer at lower cost per serving. Younger consumers are driving much of that growth. Financial pressure is also pushing buyers toward private label and more affordable retail channels.
In yogurt, 40% of US buyers rank high protein among their top three desired benefits, ahead of low sugar and low fat claims. Products pairing protein with a second benefit such as digestive health or sustained energy tend to perform better than protein alone. Recent US snack launches have positioned protein bars around 18 to 20 grams of protein per bar alongside low sugar and net carb messaging.
The pork opportunity. With beef prices rising, pork becomes comparatively more accessible. Brands able to reshape perceptions of pork and supply new usage ideas have an opening, particularly with households trading down from beef without wanting to trade out of animal protein entirely.
What we do at Bridging Local
We run custom research for businesses that need answers national datasets cannot provide. That means deep dives into a single category or segment, interviews with buyers, category managers and distributors, surveys of the consumer base you are trying to reach, pricing and willingness to pay studies, claim and concept testing, and market sizing built from the ground up rather than estimated from published aggregates.
For food manufacturers, ingredient suppliers, retailers and brands entering North America, that usually looks like testing a claim or formulation with real consumers before launch, sizing demand in a specific category or channel, mapping who is competing for the same shelf space, or working out why a product is not converting at the price you set.
Frequently Asked Questions
How big is the US high protein food market?
Packaged foods carrying a high protein claim generated $24.0 billion in US retail sales in 2025, up 3.6% on the year and 24.9% since 2021 at a compound rate of 5.7%. Snacks are the largest category at $7.42 billion, followed by dairy and alternatives at $7.30 billion, cooking ingredients and meals at $5.06 billion and staple foods at $4.19 billion. The market is forecast to reach $28.1 billion by 2029.
Is the US processed meat market growing?
Barely. Processed meat, seafood and alternatives reached $54.3 billion in 2025, growth of 0.1% in current terms. Processed meat itself grew 0.3% to $46.0 billion and was the only segment to grow. Processed seafood fell 0.7%, meat and seafood substitutes fell 0.6% and tofu fell 1.1%. The category is forecast to reach $63.3 billion by 2030 at a 3% compound rate.
Which high protein food categories are growing fastest?
By compound growth from 2021 to 2025, high protein pastries led at 35.7%, followed by popcorn at 21.8%, pretzels at 18.9%, chocolate confectionery at 13.6% and fromage frais and quark at 12.1%. In dollar terms the largest gains came from dairy and plant-based milk products, which added $1.46 billion, and sweet biscuits and snack bars, which added $688 million. Looking forward, high protein drinks are forecast to grow 60.8% by 2029, the fastest of any category.
Are plant based meat substitutes declining in the US?
Yes. Meat and seafood substitutes fell 0.6% to $1.6 billion in 2025 and tofu and derivatives fell 1.1% to $243.4 million, both declining in volume as well as value despite promotional price activity. Together they represent 3.4% of the $54.3 billion processed meat, seafood and alternatives category. Category momentum has cooled from its 2020 peak, with plant-based protein functioning largely as a complementary purchase rather than a replacement for animal protein.
Where does the US import protein ingredients from?
The United States imported $2.10 billion of protein ingredients in 2025 across 476,581 tonnes. By value, New Zealand leads at $283.1 million and 13.5% share, followed by Canada at $250.8 million and Denmark at $204.6 million. By volume Australia leads at 108,908 tonnes. Imports have fallen 30.1% in value from their 2022 peak of $3.01 billion. Denmark grew 18.4% and Brazil 15.4% over the period while Germany fell 13.3% and China 12.9%.
How does price affect US protein purchasing?
Fifty-three percent of US protein buyers say inflation has made them less likely to try new foods and 48% say they avoid items that are too expensive. Financial pressure is pushing buyers toward private label and more affordable retail channels, and toward shelf-stable and frozen formats that keep households stocked longer at lower cost per serving. Younger consumers are driving much of the shift toward these formats.
About This Analysis
This analysis was produced by Bridging Local (RC Research & Insights Inc.), a Vancouver-based market research and business consulting firm, using market and trade data published through Agriculture and Agri-Food Canada. We run primary research across B2B and B2C markets, including surveys, in-depth interviews, competitive analysis, category deep dives and go-to-market strategy.


Comments