US Bars & Nightclubs: Market Outlook 2026

US bars and nightclubs took in $36.6 billion in 2024 and reach an estimated $37.9 billion in 2026. Revenue growth has slowed from 7.1% a year to 0.4%, while the share of every sales dollar going to payroll has risen from 25 cents to 32.
In 2024, US bars and nightclubs with paid staff took in $34.9 billion. That was $146 million more than the year before, growth of 0.4%. Over the same year they paid their workers $11.2 billion, $168 million more than the year before.
Payroll grew by more dollars than revenue did. Employment fell by 12,537 people. The average bar worker earned 4.4% more.
That combination sets the outlook for 2026. The industry is still adding revenue, but slowly, and a growing share of each dollar goes to labour. Seven years ago payroll took 25.1% of bar revenue. In 2024 it took 32.1%.
Figures in this article cover NAICS 72241, drinking places serving alcoholic beverages, which includes bars, taverns, pubs, cocktail lounges and nightclubs.
The US Bar and Nightclub Market Reaches $37.9 Billion in 2026
Combining bars with paid employees and owner-operated bars without staff, the US bar and nightclub market was worth $36.6 billion in 2024 and reaches an estimated $37.9 billion in 2026.


Bars with paid employees account for 95.6% of the total. Owner-operated bars, classified as nonemployer firms, are numerous but small, averaging $55,643 in revenue each in 2023.
Revenue Growth Slowed From 7.1% a Year to 0.4%
Employer bar revenue rose from $23.9 billion in 2017 to $33.7 billion in 2022, a compound rate of 7.1% a year across a period that included pandemic closures and the recovery that followed. Since 2022 the rate has fallen in each year.


Revenue grew 3.4% in 2023 and 0.4% in 2024. The 2024 increase of $146 million across more than 40,000 venues works out to roughly $3,600 of additional revenue per bar for the year.
Bar and Nightclub Market Forecast to 2030
The forecast projects the 2022 to 2024 compound growth rate of 1.9% a year forward from 2024. On that rate the total US bar and nightclub market reaches $37.9 billion in 2026 and $40.9 billion in 2030.


The market adds $4.3 billion between 2024 and 2030, an average of roughly $720 million a year. That is well above the $146 million added in 2024, so the forecast assumes 2024 was a soft year rather than the new rate. If growth stays at the 2024 pace of 0.4%, the 2030 figure would be closer to $37.5 billion.
Payroll Has Risen From 25.1% to 32.1% of Bar Revenue
In 2017, US employer bars spent 25.1% of their revenue on payroll. By 2022 that had risen to 29.4%, by 2023 to 31.7% and by 2024 to 32.1%.
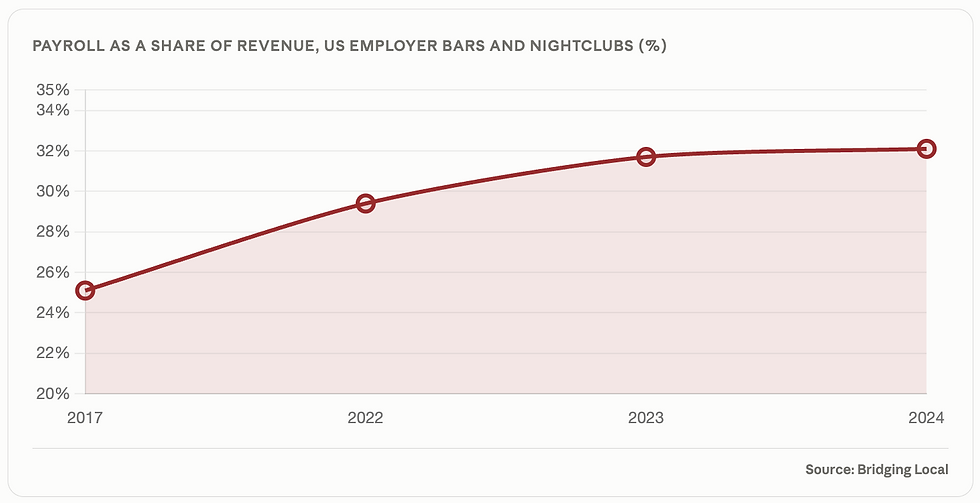

Between 2017 and 2024 revenue rose 45.9% and payroll rose 86.6%. Payroll grew nearly twice as fast as sales across the period.
"Seven years ago a bar kept 75 cents of every sales dollar after payroll. In 2024 it kept 68."
Total operating expenses for 2024 were $27.2 billion, 78.0% of revenue. Payroll accounted for 41.1% of those expenses, making it the single largest cost category.
Bar Employment Fell 2.7% in 2024 While Payroll Rose 1.5%
US employer bars had 456,621 employees in 2023 and 444,084 in 2024, a fall of 12,537 or 2.7%. Payroll rose from $11.0 billion to $11.2 billion over the same year.

Fewer people were paid more in total. Bars responded to rising labour cost by operating with smaller teams, and the remaining staff earned more on average.

Revenue per employee reached $78,665 in 2024, up 3.3% on 2023 after two years of almost no movement at around $76,000. The 2024 gain came mainly from the fall in headcount rather than from revenue growth.
Larger Bars Are Gaining Ground as the Smallest Venues Decline
Between 2022 and 2023 the number of US bar establishments rose by 577, from 40,258 to 40,835. That net figure hides movement in opposite directions by venue size.


Venues with fewer than five employees fell by 607. Venues with ten or more employees rose by 1,099. Every size band from ten employees upward grew by more than 7%.

Venues with fewer than five staff make up 38.7% of US bars but employ 7.0% of the workforce. Venues with 20 or more staff make up 13.7% of bars and employ 49.5% of workers.
Scale is becoming more valuable. In a market where payroll takes a rising share of revenue, larger venues spread fixed costs such as rent, licensing and management across more covers and more hours. The shift in the size distribution between 2022 and 2023 is consistent with that pressure favouring bigger operations.
How Many Bars Are in the US: 40,835 Venues and 29,000 Owner-Operators
The US had 40,835 bar and nightclub establishments with paid employees in 2023. On the long-run growth rate of establishments between 2017 and 2022, that reaches an estimated 41,048 in 2024 and 42,352 by 2030.
Alongside them, 29,000 owner-operated bars ran without paid staff in 2023, up from 28,000 in 2022. Owner-operated bars account for roughly four in ten bar businesses and 4.6% of industry revenue.


S-corporations run 46.1% of US bars. Individual proprietorships grew fastest at 10.8%, while partnerships fell 6.3%. The industry is structured overwhelmingly around small closely held businesses rather than large chains: C-corporations operate 12.9% of venues.
Women Own 21.8% of Employer Bars and 55.2% of Owner-Operated Bars
Among the 38,304 bars with paid employees in 2022, 21.8% were owned by women, 62.7% by men and 13.8% equally by men and women. Among owner-operated bars without staff the balance reverses.

Women own 55.2% of owner-operated bars and 21.8% of employer bars. Across both groups combined in 2022, women owned 35.2% of US bar businesses.

Female-owned employer bars generate $545,000 in revenue per firm on average, against $956,000 for male-owned bars. Women hold a larger share of bar businesses than of bar revenue, and the gap is widest among venues with paid staff.
The figures and analysis presented in this report were developed by market research firm Bridging Local, using raw data from the U.S. Census Bureau as a primary data source.
Where This Data Stops and Custom Research Begins
National figures describe the average bar. Almost no one opens, buys or finances the average bar.
The questions that follow usually need primary research. How many bars a local market can support and how many it already has. What the existing competitors charge, how busy they are etc. What customers in the target area want that is not being offered. Whether a concept, location and price point will draw enough traffic to cover rising labour and rent.
What we do at Bridging Local
We run custom research for businesses that need answers national datasets cannot provide. That means local market deep dives, competitor mapping and pricing audits, surveys and interviews with the customers you are trying to reach, location assessment, and market sizing built from the ground up for a specific trade area rather than scaled down from national totals.
For bar and nightclub operators, investors and lenders, that usually looks like testing a concept before signing a lease, sizing demand in a specific neighbourhood, understanding what competing venues offer and charge, or building the revenue case a lender will ask for.
If you are planning to open, buy or expand a bar and need evidence rather than inference, that is the work we do. Custom surveys, competitive analysis and local market deep dives, built around your specific decision.
Frequently Asked Questions
How big is the bar and nightclub industry in the US in 2026?
The US bar and nightclub market is estimated at $37.9 billion in 2026, including $36.3 billion from bars with paid employees and $1.7 billion from owner-operated bars. The total for 2024 is $36.6 billion. The 2026 figure is a Bridging Local estimate built by projecting the 2022 to 2024 growth rate of 1.9% a year forward from 2024.
What is the bar industry forecast to 2030?
The US bar and nightclub market is projected at $40.9 billion by 2030, growing at 1.9% a year from $36.6 billion in 2024. That adds $4.3 billion over six years. If growth stays at the 2024 rate of 0.4%, the 2030 figure would be closer to $37.5 billion.
How many bars are there in the United States?
There were 40,835 bar and nightclub establishments with paid employees in the US in 2023, estimated at 41,048 in 2024. A further 29,000 owner-operated bars ran without paid staff in 2023. Together that is roughly 70,000 bar businesses, though owner-operated bars account for 4.6% of industry revenue.
Is the bar industry growing in the US?
Slowly. Employer bar revenue grew at 7.1% a year between 2017 and 2022, then 3.4% in 2023 and 0.4% in 2024. Because these figures are in current dollars and include price increases, 0.4% growth in 2024 indicates that the volume of business fell in real terms. Employment also fell 2.7% in 2024.
How much of bar revenue goes to labour costs?
Payroll accounted for 32.1% of US employer bar revenue in 2024, up from 29.4% in 2022 and 25.1% in 2017. Between 2017 and 2024 payroll rose 86.6% while revenue rose 45.9%. Payroll was 41.1% of the $27.2 billion in total.
About This Analysis
This analysis was produced by Bridging Local (RC Research & Insights Inc.), a Vancouver-based market research and business consulting firm, using US Census Bureau data. We run primary research across B2B and B2C markets, including surveys, in-depth interviews, competitive analysis, local market deep dives and go-to-market strategy. We cater to markets across all regions globally, with a strong focus on the USA, Canada, and the UK.
If you are sizing a market, testing a concept, or working out where demand sits in your category, our market research services are built for exactly that.


