Canadian Tourism Market Outlook 2026: Foreign Demand Is Growing Five Times Faster Than Domestic

Tourism demand in Canada reached $28.5 billion in the second quarter of 2026, the highest quarter on record. Foreign visitor demand grew 7.3% over the year while Canadian demand grew 1.3%, and the trade war explains a large part of why.
Tourism demand in Canada reached $28.5 billion in the second quarter of 2026. Of that, $21.2 billion came from Canadians travelling in Canada and $7.3 billion from foreign visitors.
Over the year, foreign demand rose 7.3% and domestic demand rose 1.3%. Foreign visitors now account for 25.6% of tourism demand in Canada, up from 23.9% at the start of 2023.
The two halves of this market are moving at very different speeds, and the faster one is the smaller one. The trade war with the United States is a large part of the reason.
Figures in this article cover quarterly tourism demand in Canada, from the first quarter of 2023 through the second quarter of 2026.
Canadian Tourism Demand Reached $28.5 Billion in Q2 2026
Q2 2026 is the strongest quarter in the period covered. Demand has risen in every quarter since Q4 2024, from $27.4 billion to $28.5 billion.
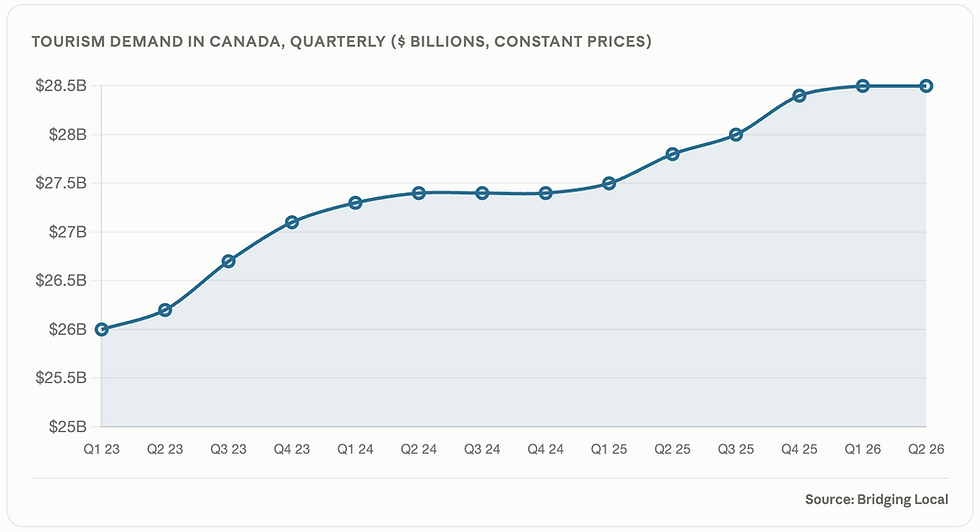

Across full years, tourism demand was $105.9 billion in 2023, $109.5 billion in 2024 and $111.6 billion in 2025. Growth ran at 3.4% in 2024 and 1.9% in 2025.
The first half of 2026 is ahead of the first half of 2025 by 3.2%, faster than either of the two previous full years.
Foreign Demand Grew 7.3% While Domestic Grew 1.3%
Tourism exports, meaning spending in Canada by foreign visitors, reached $7.3 billion in Q2 2026, up 7.3% on Q2 2025. Domestic demand reached $21.2 billion, up 1.3%.


Note: Tourism export means the revenue a country earns when international visitors spend money on goods and services within its borders.
Since Q1 2023, foreign demand has grown 16.6% and domestic demand 6.7%. The export share of tourism demand has moved from 23.9% to 25.6%, a gain of 1.7 percentage points in fourteen quarters.
"One quarter of Canadian tourism demand now comes from abroad, and that quarter is carrying most of the growth."

Domestic Tourism Demand Has Been Flat for Three Quarters
Domestic tourism demand peaked at $21.2 billion in Q4 2025 and has held at that level since. The three most recent quarters read $21.2 billion, $21.2 billion and $21.2 billion.

Foreign demand ran the other way over the same stretch, rising in each of the last four quarters from $6.8 billion in Q2 2025 to $7.3 billion in Q2 2026.
Annual growth in domestic demand has also been slowing in one respect and steady in another. It grew 2.2% in 2024 and 2.0% in 2025, then 2.6% in the first half of 2026. The quarterly pattern shows the gain came early in the period rather than in recent quarters.
The Trade War Moved Demand in Both Directions
Canadian residents made 7.1 million fewer visits to the United States in 2025 than in 2024, a decline of 23.5%. Their spending in the United States fell from nearly $15 billion to $13.3 billion. Return trips from the US declined year over year for eleven consecutive months, the longest sustained decline outside the pandemic since records began in 1972.
Those trips did not disappear, instead were redirected within the Candian territory. Canadians took roughly 5 million more domestic trips and 1.3 million more overseas trips in 2025, and spending on overseas leisure travel rose by $3.6 billion to $22.8 billion.
The domestic redirection is visible in the demand data. The largest single-quarter increase in Canadian domestic tourism demand in the entire period covered came in the second quarter of 2025, at 2.5%, when the travel boycott was at its strongest.

The boycott did not lift Canada's tourism exports
It would be reasonable to assume that a trade war which kept Canadians home also brought more Americans north. It did not, at least not in 2025. Fewer Americans visited Canada that summer, and their tourism spending in Canada fell 1.7%.
That shows in the export series. Tourism exports grew 7.2% in 2024, then slowed sharply to 1.6% in 2025, the weakest year in the period. Growth over that year came from elsewhere: overseas visitors between May and August 2025 rose 2.4% and their spending rose 10.4%.

Americans Are Coming Back, but Canadians Are Leaving Again
Both sides of the border reversed in 2026. US-resident trips to Canada reached 3.6 million in the first quarter, up 3.4%. In July they rose 6.5% to 2.7 million, and in August 2.4% to 2.4 million.

Tourism exports followed, rising 5.0% in the first half of 2026 after 1.6% in 2025.
Canadians resumed travelling south at the same time. August 2026 marked the fifth consecutive month of year over year growth in Canadian return trips from the United States, up 8.8% to 2.6 million. That recovery coincides almost exactly with the three flat quarters in domestic tourism demand.

The recovery is real but partial. Car trips to the United States in August 2026 were 9.9% above August 2025 and still 27.4% below August 2024. Air trips were 3.6% above last year and 22.7% below two years ago.

Where this leaves a Canadian operator. The two flows are now working against each other. American arrivals are recovering, which supports export-facing businesses. Canadian outbound travel is also recovering, which removes the domestic tailwind that carried 2025. If Canadian trips to the US return toward 2024 levels, roughly 27% more car travel south, the domestic line has further to fall before inbound growth offsets it.
Transportation Is 37.9% of Canadian Tourism Demand
Transportation accounted for $10.8 billion of the $28.5 billion spent in Q2 2026. Passenger air transport alone accounted for $6.4 billion, or 22.5% of all tourism demand.


Tourism products account for 85.6% of demand and other products, meaning goods and services bought by travellers that are not tourism-specific, account for 14.4%.
Within transportation, air travel dominates. Passenger air at $6.4 billion is more than four times the next largest line, vehicle fuel at $1.6 billion. Passenger rail at $0.1 billion is the smallest transport category in the dataset.
Vehicle Rental Is Growing Fastest, Travel Services Is Shrinking
Two categories grew by more than 15% over the year. Two declined.
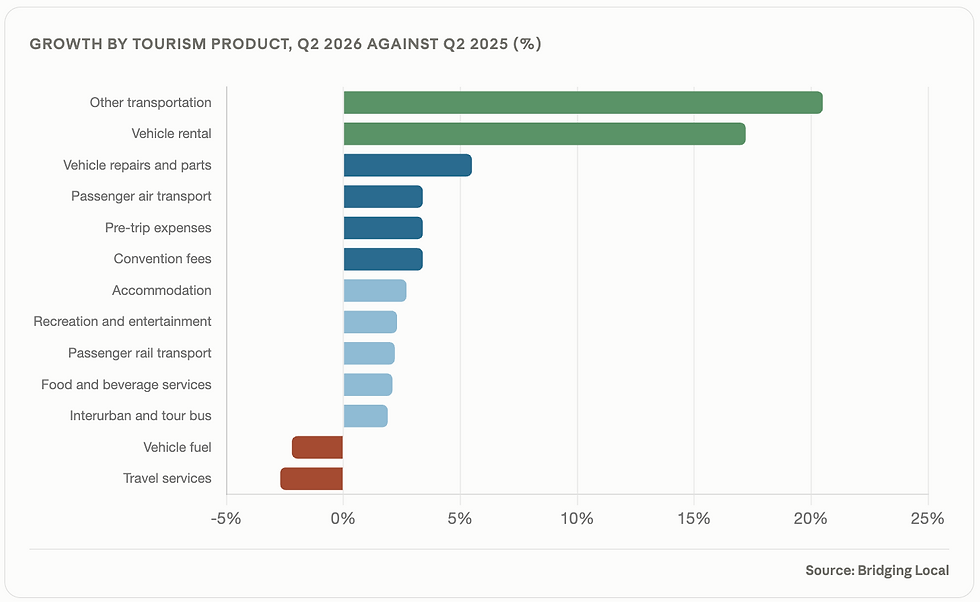

Travel services, which covers travel agents and tour operators, fell 2.7% to $1.2 billion. The decline sits entirely on the domestic side: Canadian spending on travel services fell 4.2% while foreign spending on them rose 4.7%.
Vehicle fuel fell 2.2% while vehicle rental rose 17.2% and vehicle repairs and parts rose 5.5%. More people are renting vehicles and fewer are buying fuel for their own.
Accommodation Is the Most Export-Exposed Category at 32.8%
Foreign visitors account for 32.8% of accommodation demand in Canada, the highest share of any major category.
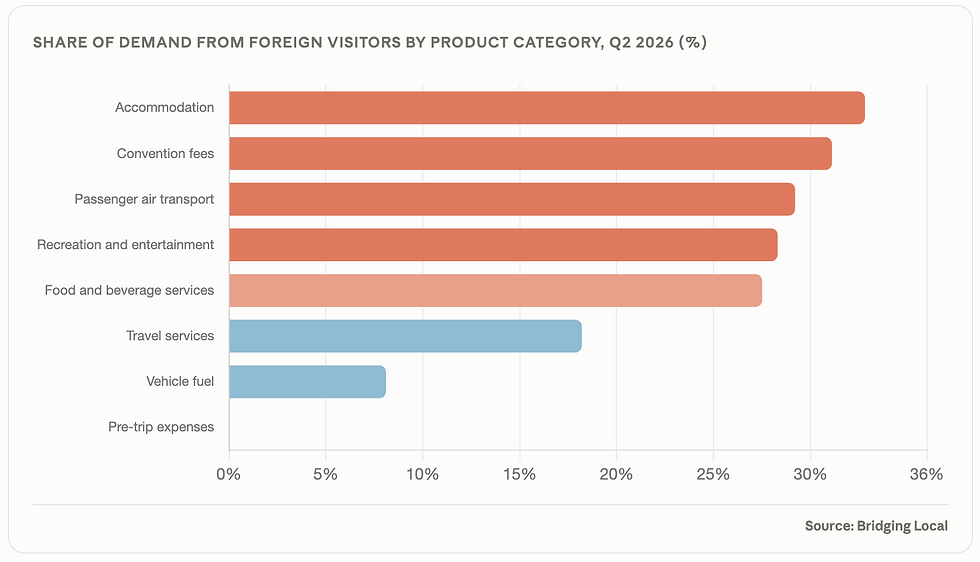

The spread across categories is wide. Accommodation, convention fees, air travel, recreation and food service all draw between 27% and 33% of their demand from abroad. Vehicle fuel draws 8.1%, and pre-trip expenses are entirely domestic by definition.
Where 2026 Finishes on Current Run Rate
We estimate total tourism demand for 2026 at $115.2 billion, comprising $85.8 billion in domestic demand and $29.4 billion from international visitors.


That would add $3.6 billion in a single year, against $2.1 billion added in 2025. Foreign demand would account for $1.4 billion of the increase from a base one third the size of the domestic market.

Frequently Asked Questions
How big is the Canadian tourism market in 2026?
Tourism demand in Canada reached $28.5 billion in the second quarter of 2026, the highest quarter on record. The first half of 2026 totalled $57.0 billion, up 3.2% on the first half of 2025. On that run rate the full year would reach $115.2 billion, against $111.6 billion in 2025 and $109.5 billion in 2024. All figures are in constant 2017 prices.
How has the trade war affected tourism in Canada?
In two opposite directions. Canadians made 7.1 million fewer trips to the United States in 2025, a fall of 23.5%, and redirected roughly 5 million trips to destinations inside Canada. That produced the largest single-quarter rise in Canadian domestic tourism demand in the period covered, 2.5% in the second quarter of 2025. But American visits to Canada also fell that year and their spending dropped 1.7%, so tourism exports grew only 1.6% in 2025, the weakest in the series. Both flows reversed in 2026.
Are Americans visiting Canada more in 2026?
Yes. US-resident trips to Canada reached 3.6 million in the first quarter of 2026, up 3.4%. In July they rose 6.5% to 2.7 million, including 1.9 million by automobile and 749,000 by air, with cruise disembarkations up 28.8%. In August trips rose 2.4% to 2.4 million, with air arrivals up 6.8%. Canada's tourism exports grew 5.0% in the first half of 2026, up from 1.6% across 2025.
Are Canadians travelling to the US again?
Partially. August 2026 was the fifth consecutive month of year over year growth in Canadian return trips from the United States, up 8.8% to 2.6 million. The recovery is incomplete: car trips in August 2026 remained 27.4% below August 2024 and air trips 22.7% below. That partial return coincides with three flat quarters in Canadian domestic tourism demand.
How much of Canadian tourism comes from foreign visitors?
25.6% of tourism demand in Canada came from foreign visitors in the second quarter of 2026, worth $7.3 billion of the $28.5 billion total. That share has risen from 23.9% at the start of 2023. Accommodation is the most export-exposed category at 32.8%, followed by convention fees at 31.1% and passenger air transport at 29.2%.
What do tourists spend the most on in Canada?
Transportation, at $10.8 billion or 37.9% of tourism demand in the second quarter of 2026. Passenger air transport alone accounts for $6.4 billion, or 22.5% of all tourism demand. Accommodation follows at $5.3 billion and 18.7%, then other tourism products at $4.9 billion, non-tourism goods and services at $4.1 billion, and food and beverage services at $3.4 billion.
About This Analysis
This analysis was produced by Bridging Local (RC Research & Insights Inc.), a Vancouver-based market research and business consulting firm. We run primary research across B2B and B2C markets, including surveys, in-depth interviews, competitive analysis, local market deep dives and go-to-market strategy.
If you are sizing a market, testing a concept, or working out where demand sits in your category, our market research services are built for exactly that.


