Canadian Cannabis Market Outlook 2026: Dried Flower Is Losing Share as the Market Grows

Canadian cannabis retail sales reached $5.6 billion in 2025 and are running 5.9% ahead through the first seven months of 2026. Flower still holds 58.5% of the market, down from 60.1% two years ago, while extracts and edibles take the gains.
Canadians bought $3.4 billion of cannabis at retail in the first seven months of 2026, up 5.9% on the same period in 2025 and 11.4% on 2024.
Across the full year 2025, retail cannabis sales reached $5.6 billion, up 4.2% on 2024.
The market is still growing, and the growth is no longer coming from flower. Dried flower rose 4.4% over the first seven months of 2026 while extracts and concentrates rose 7.8% and edibles rose 10.0%. Flower's share of the market has fallen from 60.1% in 2024 to 58.5%.
Figures in this article cover Canadian monthly retail cannabis sales from January 2024 through July 2026, in current dollars.
Canadian Cannabis Retail Sales Reached $5.6 Billion in 2025
Retail cannabis sales totalled $5.6 billion in 2025, up from $5.4 billion in 2024. Monthly sales averaged $468.4 million in 2025 against $449.5 million in 2024, and $485.4 million across the first seven months of 2026.


The series has a mild seasonal shape. February is the weakest month in all three years and the May to August stretch the strongest. February 2024 at $402.3 million is the lowest month in the period and June 2026 at $516.4 million the highest, a range of $114.1 million.
Growth Accelerated From 5.1% to 5.9% in 2026
Comparing the same seven months across three years shows growth picking up. The first seven months of 2025 were 5.1% ahead of 2024. In 2026 the gap has widened to 5.9%.


Every month in 2026 is ahead of the same month in 2025. The range runs from 2.3% in July to 9.2% in January, and the pattern is uneven rather than steadily improving.
Dried Flower Is Growing Slower Than the Market It Dominates
Dried flower generated $2.0 billion over the first seven months of 2026, 58.5% of all retail cannabis sales. It grew 4.4%, below the 5.9% market rate.


Flower held 60.1% of the market over the first seven months of 2024. It now holds 58.5%, a loss of 1.6 percentage points in two years. Extracts, concentrates and other products moved the other way, from 33.6% to 35.2%.

Edibles Are the Fastest Growing Format at 10.0%
Cannabis-infused edibles generated $212.1 million over the first seven months of 2026, up 10.0% on 2025 and 12.8% on 2024. It is the fastest growing of the three published formats.

The edibles recovery is recent. Across the full year 2025 the category was effectively flat at 0.3% growth, and it recorded its weakest months of the entire period in September and October 2025, at $24.6 million and $23.9 million. Every month of 2026 has run above $27.7 million.
At 6.2% of sales, edibles remain the smallest published format. Their $19.3 million of additional sales over the first seven months of 2026 compares with $83.7 million for dried flower and $86.7 million for extracts and concentrates.

June 2026 Was the Strongest Month at $516.4 Million
June 2026 recorded $516.4 million in retail cannabis sales, the highest single month in the period covered. It beat the previous high, May 2026 at $510.4 million.

Five of the ten strongest months in the series fall in 2026, and four of those five are between April and July. December appears twice, reflecting a holiday lift that is visible in each year of the data.
February is the weakest month in all three years, at $402.3 million in 2024, $408.2 million in 2025 and $439.1 million in 2026. The February to June swing within 2026 alone is $77.3 million, or 17.6%.
Where 2026 Finishes on Current Run Rate
Applying the January to July growth rate of 5.9% to the remainder of the year gives full-year 2026 retail cannabis sales of $6.0 billion.
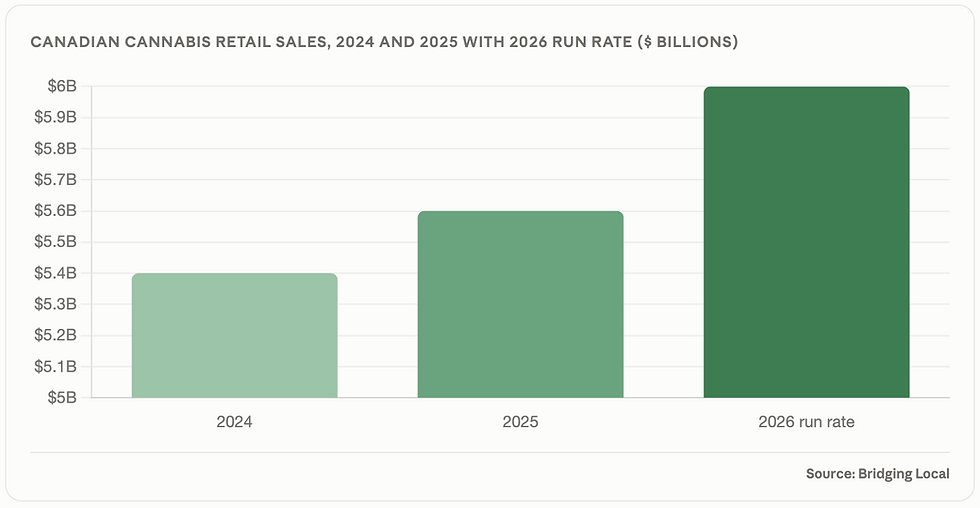

That would add $333.0 million to the market in a single year, against $226.3 million added in 2025.

What we do at Bridging Local
We run custom research for businesses that need answers national datasets cannot provide. That means local market deep dives, competitor and pricing audits, surveys and interviews with the consumers you are trying to reach, location assessment, and market sizing built from the ground up for a specific trade area rather than scaled down from national totals.
For licensed producers, retailers and investors, that usually looks like testing a product or price point before launch, sizing demand in a defined area, understanding what competing stores carry and charge, or building the revenue case a lender or board will ask for.
If you are launching, buying or expanding in cannabis and need evidence rather than inference, that is the work we do. Custom surveys, in-depth interviews, competitive analysis and local market deep dives, built around your specific decision.
Frequently Asked Questions
How big is the Canadian cannabis market in 2026?
Canadians bought $3.4 billion of cannabis at retail in the first seven months of 2026, up 5.9% on the same period in 2025. On that run rate the full year would reach $6.0 billion. Retail sales were $5.6 billion in 2025 and $5.4 billion in 2024. These are consumer retail sales in current dollars.
Is the Canadian cannabis market still growing?
Yes, and faster than last year. Sales grew 4.2% across 2025 and are running 5.9% ahead through the first seven months of 2026. Every month of 2026 is ahead of the same month in 2025, ranging from 2.3% in July to 9.2% in January. Because the figures are in current dollars, growth reflects both volume and price.
What cannabis products sell the most in Canada?
Dried flower, at $2.0 billion over the first seven months of 2026 and 58.5% of retail sales. Extracts, concentrates and other products follow at $1.2 billion and 35.2%, and edibles at $212.1 million and 6.2%. Flower's share has fallen from 60.1% over the same months of 2024.
Which cannabis format is growing fastest in Canada?
Edibles, at 10.0% over the first seven months of 2026, followed by extracts and concentrates at 7.8% and dried flower at 4.4%. In dollar terms the ranking reverses: extracts and concentrates added $86.7 million, dried flower $83.7 million and edibles $19.3 million.
Are cannabis edibles growing in Canada?
Strongly in 2026, after a flat 2025. Edibles grew 0.3% across 2025 and hit their weakest months of the period in September and October that year, at $24.6 million and $23.9 million. Over the first seven months of 2026 they grew 10.0% to $212.1 million, with every month above $27.7 million.
When do Canadians buy the most cannabis?
Late spring and early summer. June 2026 was the strongest month in the period at $516.4 million, followed by May 2026 at $510.4 million. February is the weakest month in all three years, at $402.3 million in 2024, $408.2 million in 2025 and $439.1 million in 2026. December shows a consistent holiday lift in each year.
About This Analysis
This analysis was produced by Bridging Local (RC Research & Insights Inc.), a Vancouver-based market research and business consulting firm. We run primary research across B2B and B2C markets, including surveys, in-depth interviews, competitive analysis, local market deep dives and go-to-market strategy.
If you are sizing a market, testing a concept, or working out where demand sits in your category, our market research services are built for exactly that.


