Canadian Home Furniture Market Outlook 2026: The Category Is Shrinking While Retail Grows

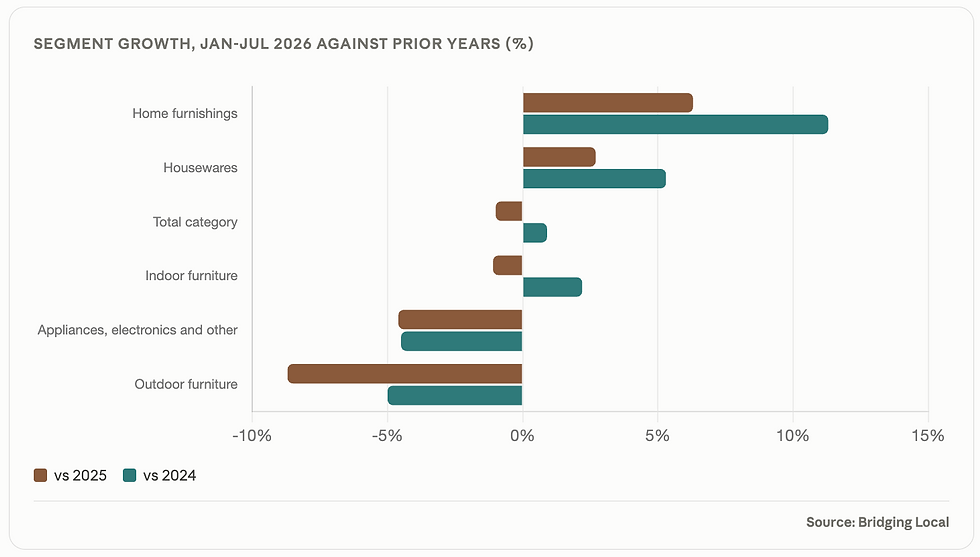
Canadians spent $39.0 billion on furniture, furnishings, housewares, appliances and electronics in the first seven months of 2026, down 1.0%. Over the same months all retail sales rose 4.2%. The category has lost share in every year of the data.

December 2024 at $7.8 billion is the highest month in the period and February 2026 at $4.7 billion the lowest. The gap between the category's quietest and busiest month is $3.2 billion.
Home Goods Have Lost 0.6 Points of Retail Share in Two Years
Measured against all Canadian retail commodity sales, the category accounted for 8.39% of spending over the first seven months of 2024, 8.19% in 2025 and 7.78% in 2026.


The loss is 0.6 percentage points in two years, and it accelerated. Share fell 0.2 points between 2024 and 2025 and 0.4 points between 2025 and 2026. On the full-year view the category held 8.80% of retail in 2024 and 8.61% in 2025.
Canadian consumers are not spending less. They are spending $20.3 billion more at retail than a year earlier, and home goods captured none of it. For an operator, this is harder than a general downturn: the money is in the economy and moving to other categories, so the response is competitive rather than a matter of waiting out weak demand.
Appliances and Electronics Are Driving the Decline
Appliances, electronics and other products not separately published account for $16.0 billion of category sales, 41.1% of the total and the largest segment by a wide margin. The segment fell 4.6% over the first seven months of 2026.


The segment lost $773 million over the year. The three growing or flat segments added $397 million between them, leaving the category $395 million down.
Its share of the category has fallen from 43.4% over the first seven months of 2024 to 41.1% in 2026, a loss of 2.3 percentage points in two years.
Home Furnishings Is the Only Segment Growing Meaningfully
Home furnishings generated $4.7 billion over the first seven months of 2026, up 6.3% on 2025 and 11.3% on 2024. It is the only segment growing faster than total retail.
Across the full year 2025 home furnishings grew 7.3% to $9.5 billion, against 1.5% for housewares and 1.1% for indoor furniture. It is the only segment that has grown consistently in both the full-year and year-to-date views.
Housewares is the second largest segment at $10.4 billion and 26.8% of the category, growing 2.7%. That is positive but below the 4.2% retail rate, so housewares is also losing share of the consumer wallet even while it grows.

Indoor Furniture Has Gone Flat and Outdoor Has Fallen 8.7%
Indoor home furniture generated $6.8 billion over the first seven months of 2026, down 1.1% on 2025 and up 2.2% on 2024. Across the full year 2025 it grew 1.1% to $12.1 billion.

Indoor furniture has been effectively flat for two and a half years. Monthly sales have moved between $807.6 million and $1.11 billion across the entire period, and the category has not established a direction in either year.
Outdoor furniture fell 8.7% to $995.5 million over the first seven months of 2026, the steepest decline of any segment. It is also 5.0% below its 2024 level, the only segment below where it stood two years ago.
Furniture is where a housing slowdown shows up first. Indoor furniture purchases are concentrated around moves, renovations and household formation rather than replacement cycles. A segment that has been flat for ten consecutive quarters while retail grew is behaving like one whose demand trigger has stalled, not one losing customers to a competitor.
Six of Seven Months in 2026 Are Below Last Year
Only June 2026 came in ahead of the same month in 2025, at 3.7%. Every other month was lower.


The same seven months of 2025 ran 1.9% ahead of 2024. The category went from modest growth to modest decline in a single year while retail accelerated around it.
Outdoor Furniture Sells Fifteen Times More in May Than February
Outdoor furniture recorded $280.2 million in May 2026 and $18.7 million in February 2026, a ratio of 15.0 to 1. It is the most seasonal line in this category by a wide margin.

Home furnishings runs the opposite calendar. It peaked at $1.32 billion in December 2025 against $541.8 million in February 2026, a ratio of 2.4 to 1, with November and December together accounting for roughly 27.8% of its annual sales.
At category level the seasonality is milder. December 2025 at $7.8 billion was 1.7 times February 2026 at $4.7 billion. Housewares and indoor furniture both run relatively steady across the year, which flattens the combined picture.
Where 2026 Finishes on Current Run Rate
Applying the January to July rate of -1.0% to the remainder of the year gives full-year 2026 category sales of $71.9 billion, a decline of $730 million on 2025.

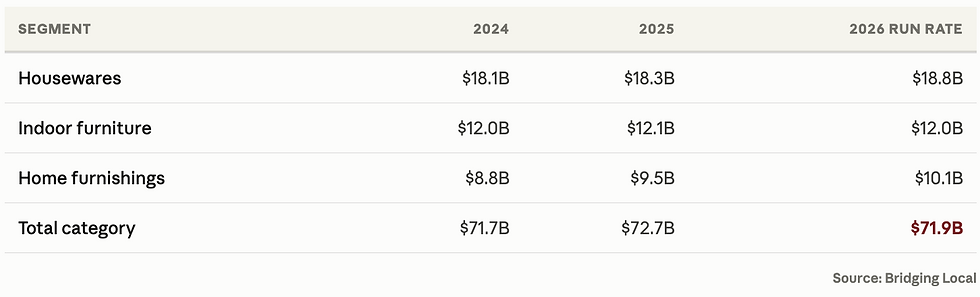
That would put the category below its 2024 level. Home furnishings would reach $10.1 billion, its third consecutive year of growth, while the category around it contracts.
Looking to hire Bridging Local for your next custom research project?
We run custom research for businesses that need answers national datasets cannot provide. That means local market deep dives, competitor and pricing audits, surveys and interviews with the shoppers you are trying to reach, location assessment, and market sizing built from the ground up for a specific trade area rather than scaled down from national totals.
For retailers, manufacturers, importers and investors, that usually looks like testing a range or price point before a buy, sizing demand in a specific catchment, understanding what competitors offer and charge, or building the revenue case a lender will ask for.
If you are operating, buying or investing in home goods retail and need evidence rather than inference, that is the work we do. Custom surveys, in-depth interviews, competitive analysis and local market deep dives, built around your specific decision.
Frequently Asked Questions
How big is the Canadian home furniture and home goods market in 2026?
Canadians spent $39.0 billion on home furniture, furnishings, housewares, appliances and electronics in the first seven months of 2026, down 1.0% on the same period in 2025. On that run rate the full year would reach $71.9 billion, against $72.7 billion in 2025 and $71.7 billion in 2024. These are consumer retail sales in current dollars.
Is the Canadian furniture market growing or shrinking?
Shrinking, and in a growing retail market. The category fell 1.0% over the first seven months of 2026 while total Canadian retail sales rose 4.2%. Six of the seven published months of 2026 came in below the same month of 2025. The category's share of all retail has fallen from 8.39% in 2024 to 7.78% in 2026.
Which home goods segment is performing worst in Canada?
Outdoor furniture by rate, down 8.7% over the first seven months of 2026 and 5.0% below its 2024 level. By dollars the larger problem is appliances, electronics and other products, which fell 4.6% and lost $773 million. That segment is 41.1% of the category, so its decline outweighs the gains everywhere else and pulls the whole category negative.
Which home goods segment is growing fastest in Canada?
Home furnishings, up 6.3% over the first seven months of 2026 to $4.7 billion and 11.3% above its 2024 level. It is the only segment growing faster than total retail. Housewares grew 2.7% to $10.4 billion, indoor furniture fell 1.1% to $6.8 billion, and outdoor furniture fell 8.7% to $995.5 million.
How is indoor furniture performing in Canada?
Flat. Indoor furniture generated $6.8 billion over the first seven months of 2026, down 1.1% on 2025 and up 2.2% on 2024, and grew 1.1% across the full year 2025. Monthly sales have moved within a narrow band between $807.6 million and $1.11 billion across the entire two and a half year period without establishing a direction.
How seasonal is the Canadian home goods market?
It depends entirely on the segment. Outdoor furniture sold $280.2 million in May 2026 against $18.7 million in February 2026, a ratio of 15.0 to 1. Home furnishings peaks in the opposite half of the year, at $1.32 billion in December 2025 against $541.8 million in February 2026. At category level the swing is milder, with December 2025 at 1.7 times February 2026.
About This Analysis
This analysis was produced by Bridging Local (RC Research & Insights Inc.), a Vancouver-based market research and business consulting firm. We run primary research across B2B and B2C markets, including surveys, in-depth interviews, competitive analysis, local market deep dives and go-to-market strategy.
If you are sizing a market, testing a concept, or working out where demand sits in your category, our market research services are built for exactly that.


