Canadian Food Service Industry 2026: A $100 Billion Market Growing Faster Than Last Year

Canadian restaurants, bars and caterers took in $100.2 billion in 2025 and are running 5.9% ahead through the first seven months of 2026. Full-service restaurants are growing faster than quick service for the first time in the series.
Canadian food service and drinking places took in $60.1 billion in the first seven months of 2026, up 5.9% on the same period in 2025 and 10.7% on 2024.
Across the full year 2025, receipts reached $100.2 billion. That was up 4.4% on 2024, when the industry took in $96.0 billion.
Growth is running faster this year than last. Over the same seven months, 2025 was 4.5% ahead of 2024. In 2026 the gap has widened to 5.9%, and July was the strongest month of the year at 8.2% above July 2025.
Figures in this article cover Canadian food service and drinking places receipts by month, unadjusted, from January 2024 through July 2026.
Canadian Food Service Receipts Passed $100 Billion in 2025
Total receipts reached $100.2 billion in 2025, up from $96.0 billion in 2024. Monthly receipts averaged $8.3 billion in 2025 against $8.0 billion in 2024.


The series has a consistent shape. January and February are always the weakest months and May through August the strongest. January 2024 at $6.7 billion is the lowest month in the period and July 2026 at $9.8 billion the highest, a range of $3.1 billion between the industry's quietest and busiest months.
Growth Accelerated From 4.5% to 5.9% in 2026
Comparing the same seven months across three years shows growth picking up rather than slowing.


Every month in 2026 is ahead of the same month in 2025. The weakest comparison is March at 3.9% and the strongest is July at 8.2%. The second quarter ran at 5.2% and the third quarter opened at 8.2%.
Full-Service Restaurants Are Outgrowing Quick Service
Full-service restaurants took in $26.1 billion in the first seven months of 2026, up 7.3% on 2025. Limited-service eating places took in $27.9 billion, up 5.1%.
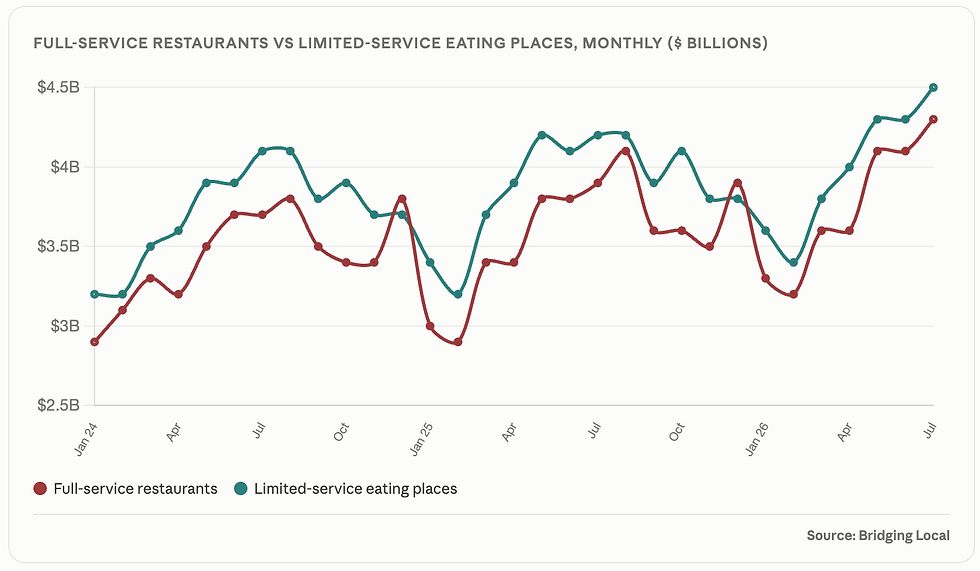

Limited-service is still the larger segment, at 46.4% of receipts against 43.5% for full-service. But the gap is closing. In the first seven months of 2024 limited-service held 46.7% and full-service 43.0%, a gap of 3.7 points. In 2026 it is 2.9 points.
Limited-service outsells full-service in every month of the series except one. In December, full-service pulls ahead: $3.8 billion against $3.7 billion in December 2024, and $3.9 billion against $3.8 billion in December 2025. Holiday dining is the one occasion each year where sit-down restaurants take more money than quick service.
Drinking Places Are the Only Segment Losing Share
Drinking places took in $2.4 billion across 2025, down 1.3% on 2024. It is the only segment in the industry to record a full-year decline.

The segment has recovered somewhat in 2026, up 2.4% over the first seven months, but that is still the slowest of the four and well below the 5.9% industry rate. Its share of receipts has fallen from 2.6% in the first seven months of 2024 to 2.4% in 2026.
Special food services, which covers caterers, food service contractors and mobile operators, grew 6.0% across 2025, the fastest of the four segments that year. In 2026 it is running at 4.8%, below full-service and limited-service.

July 2026 Was the Strongest Month on Record at $9.8 Billion
July 2026 receipts reached $9.8 billion, the highest single month in the period covered. It beat the previous high, August 2025 at $9.2 billion, by 6.2%.

Eight of the ten strongest months in the series fall between May and August. The industry's revenue is heavily concentrated in the warm half of the year, with a secondary peak in December.
What the seasonality means for cash planning. The gap between the weakest and strongest month runs to roughly $3.1 billion nationally, close to 45% of a weak month's receipts. For an individual operator that swing translates into working capital pressure in January and February that has to be funded out of summer trading.
Manitoba and Alberta Lead Provincial Growth
Manitoba recorded the fastest growth among the provinces at 10.9%, followed by Alberta at 8.0% and Nova Scotia at 7.0%.

Ontario accounts for 38.9% of national receipts and Quebec 19.1%. Together with British Columbia and Alberta, the four largest provinces represent 88.6% of the market.
Every province is ahead of 2024 by at least 6.6%, and eight of ten are ahead by more than 9.7%. Nova Scotia leads the two-year comparison at 13.9%, followed by New Brunswick at 13.0% and Alberta at 12.4%.
Prince Edward Island is the most seasonal market in Canada. Receipts ran at $29.1 million in January 2026 and $54.6 million in July, an increase of 87.4% between the quietest and busiest month. Nationally the equivalent swing is 28.6%. A tourism-weighted market concentrates a year of trading into a short season, which changes how a business there has to be financed.
BC Is a Full-Service Market, the Atlantic and Prairies Are Quick Service
The mix between sit-down and quick service varies more across provinces than any other measure in this data.
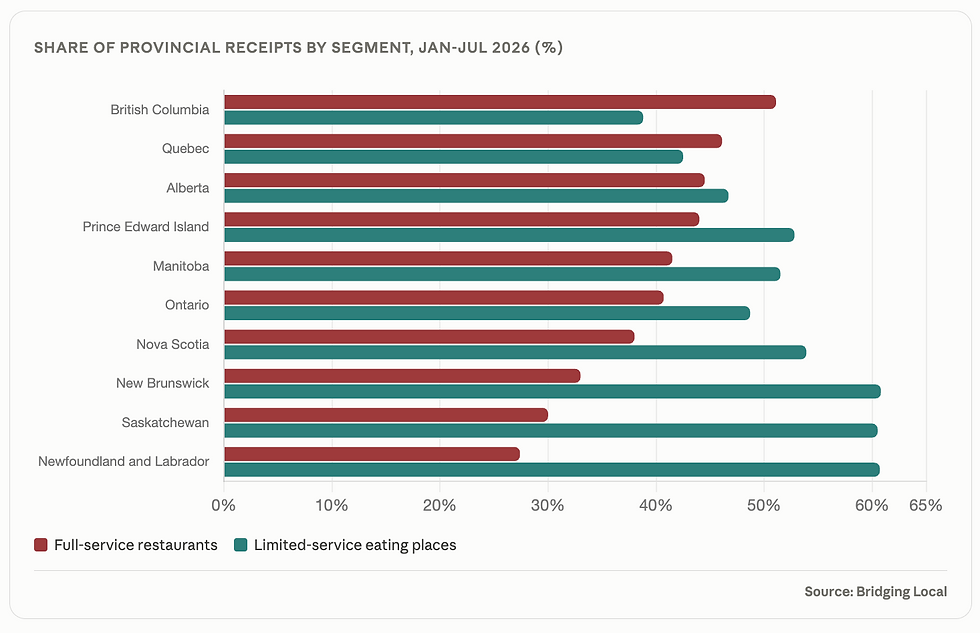
British Columbia is the only province where full-service restaurants take more than half of food service receipts, at 51.1% against 38.8% for limited-service. Quebec is next at 46.1% full-service.
The pattern reverses in the Atlantic provinces and Saskatchewan. New Brunswick sits at 60.8% limited-service against 33.0% full-service, Newfoundland and Labrador at 60.7% against 27.4%, and Saskatchewan at 60.5% against 30.0%.
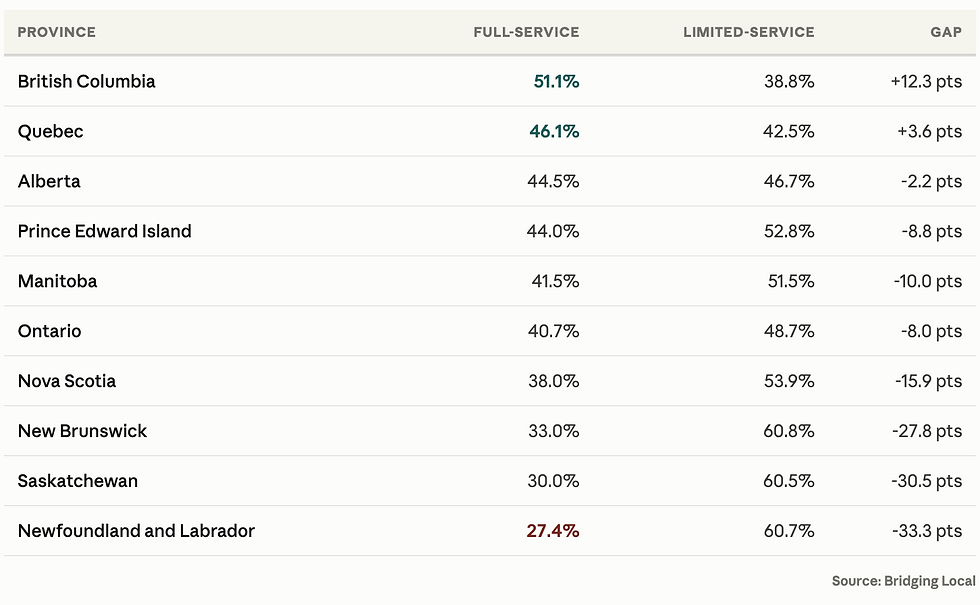
The spread between British Columbia at 51.1% full-service and Newfoundland and Labrador at 27.4% is 23.7 percentage points. Provincial shares do not sum to 100% because special food services and drinking places make up the remainder.
Where 2026 Finishes on Current Run Rate
Applying the January to July growth rate of 5.9% to the remainder of the year gives full-year 2026 receipts of $106.1 billion.


That would add $6.0 billion to the industry in a single year, against $4.2 billion added in 2025.

Need a custom detailed research report on your target local market?
We run custom research for businesses that need answers national datasets cannot provide. That means local market deep dives, competitor mapping and menu pricing audits, surveys with the customers you are trying to reach, location assessment, and market sizing built from the ground up for a specific trade area rather than scaled down from national totals.
For restaurant operators, franchisors, suppliers and investors, that usually looks like testing a concept before signing a lease, sizing demand in a specific neighbourhood, understanding what competing venues offer and charge, or building the revenue case a lender will ask for.
If you are opening, buying or expanding a food service business and need evidence rather than inference, that is the work we do. Custom surveys, in-depth interviews, competitive analysis and local market deep dives, built around your specific decision.
We also offer full time consulting services for small business owners who are looking for an extended support.
Frequently Asked Questions
How big is the Canadian food service industry in 2026?
Canadian food service and drinking places took in $60.1 billion in the first seven months of 2026, up 5.9% on the same period in 2025. On that run rate the full year would reach $106.1 billion. The industry recorded $100.2 billion in 2025 and $96.0 billion in 2024.
Is the Canadian restaurant industry growing?
Yes, and faster than last year. Receipts grew 4.4% across 2025 and are running 5.9% ahead through the first seven months of 2026. Every month of 2026 is ahead of the same month in 2025, from 3.9% in March to 8.2% in July. These figures are in current dollars and include menu price increases.
Are full-service or quick-service restaurants growing faster in Canada?
Full-service. Full-service restaurants grew 7.3% over the first seven months of 2026 against 5.1% for limited-service eating places. Limited-service remains the larger segment at 46.4% of receipts against 43.5% for full-service, but the gap has narrowed from 3.7 percentage points in 2024 to 2.9 points in 2026. Limited-service outsells full-service in every month except December.
Which province has the largest food service market in Canada?
Ontario, with $23.4 billion in receipts over the first seven months of 2026, or 38.9% of the national total. Quebec follows at $11.5 billion and 19.1%, British Columbia at $10.5 billion and 17.4%, and Alberta at $7.9 billion and 13.2%. Together the four largest provinces represent 88.6% of Canadian food service receipts.
Which province has the fastest growing restaurant market?
Manitoba, at 10.9% growth over the first seven months of 2026 against the same period in 2025. Alberta follows at 8.0% and Nova Scotia at 7.0%. Prince Edward Island is slowest at 3.9%. Measured against 2024, Nova Scotia leads at 13.9%, followed by New Brunswick at 13.0% and Alberta at 12.4%.
How seasonal is the Canadian food service industry?
Substantially. Nationally, receipts ranged from $6.7 billion in January 2024 to $9.8 billion in July 2026, and eight of the ten strongest months fall between May and August. Prince Edward Island is the most seasonal provincial market, with July 2026 receipts 87.4% above January 2026. December is the one month each year when full-service restaurants take more money than quick service.
About This Analysis
This analysis was produced by Bridging Local (RC Research & Insights Inc.), a Vancouver-based market research and business consulting firm. We run primary research across B2B and B2C markets, including surveys, in-depth interviews, competitive analysis, local market deep dives and go-to-market strategy.
If you are sizing a market, testing a concept, or working out where demand sits in your category, our market research services are built for exactly that.


