Is Laundromat a Good Business? A Complete Feasibility Analysis
- Rahul

- May 12
- 22 min read
Updated: May 13
The short answer: it depends and what it depends on is more demanding than most people expect.

Every few years, the laundromat resurfaces as a "recession-proof" business idea. Forums light up, YouTube channels publish six-figure income claims, and a fresh wave of aspiring investors starts searching for available coin laundries in their city. Some of them succeed. Many do not.
The difference between the two groups is rarely luck. It comes down to whether they did the homework before signing a lease or wiring a deposit. This article is that homework, a structured feasibility analysis that covers every factor a serious investor needs to understand before putting money into a laundromat business.
We will cover the market fundamentals, what makes a location viable, how revenue is actually built, who the real customers are, what the risks look like, and what the industry data says about who wins and who loses. No hype. No vague optimism. Just the full picture.
The State of the Market: $7.1 Billion and Growing
The US laundromat industry reached approximately $7.1 billion in revenue in 2025, growing at a compound annual growth rate of 3.2% since 2020. That is not explosive growth, but it is consistent, and consistency matters in a business that depends on repeat customers showing up week after week.
In Canada the market is valued at CAD 1.6 billion.
What makes that number meaningful is what sits underneath it. Laundromat revenue is not discretionary spending. Renters without in-home laundry do not stop doing laundry during a recession. They do not switch to a competitor app. They show up at the nearest clean, working facility because they have no other option. That structural demand is the foundation of the entire business case.
According to US Census data, approximately 19.6 million households, roughly 16% of all US households, do not have access to a washer and dryer. Among households below the federal poverty line, that figure rises to 35%. Among renter-occupied households, the dependency on external laundry facilities is significantly higher still.
Industry profitability has recovered well from pandemic disruption. Profit margins reached 13.9% in 2025, supported by operators who invested in energy-efficient equipment to offset rising utility costs. The businesses that struggled were those that did not adapt, aging equipment, no value-added services, and no digital presence. The businesses that thrived leaned into modernisation.
For a new entrant, this creates a genuine opportunity. A large share of the existing stock is owned by independent operators who have not upgraded in a decade. Their customers are loyal by geography, not by choice. A better-run competitor a half-mile away changes the equation quickly.
The Research Framework: What You Actually Need to Evaluate
Before you can assess whether a specific laundromat is a good investment, you need a framework that covers the right variables in the right order. Most investors get fixated on the asking price. That is the last thing to think about.
Here is the five-layer framework we use.

Layer 1: Market Analysis. What is the national and regional demand environment? Is the industry growing or contracting in your target area? What service trends are gaining traction, and which segments are declining?
Layer 2: Location Intelligence. What are the demographics within a 1-mile, 2-mile, and 3-mile radius? What percentage of households are renter-occupied? What is the income profile? How dense is the population? What does the crime grade look like?
Layer 3: Competitor Research. Who else is operating in the trade area? What services do they offer? What are their ratings, hours, pricing, and payment options? Where are the gaps?
Layer 4: Customer Profiling. Who actually walks through the door, and why do they choose one laundromat over another? What does the ideal customer profile look like at a demographic level?
Layer 5: Financial Modelling. What is the realistic revenue range for this specific location? What does the cost structure look like? What is the payback period on equipment, and what ROI is achievable?
Every layer informs the next. You cannot model revenue accurately without understanding location. You cannot assess location without understanding customer profile. Skipping steps is how investors end up owning a laundromat in an affluent suburb with 17% renter occupancy and no customers.
The 8 Factors We Score
When evaluating any laundromat opportunity, whether an acquisition, a new build, or a conversion, these are the eight factors that determine viability. Each one can be scored, graded, and weighted to produce an overall feasibility score.
Important Note: The below are the scores of national market in general, these will change based on specific location.
1. Market Demand - Score: 7.0/10 (Grade: B)
Market demand for laundromats is real and structural but it is not uniform, and that distinction matters enormously. The core demand driver is households without in-home laundry access. Nationally, 16% of households, approximately 19.6 million in the US, lack a washer and dryer. In lower-income urban areas, that figure can exceed 35%. In renter-dense urban markets, the proportion of residents who need a laundromat is not a market share question, it is a geography question.
The reason this scores a B rather than an A is that national demand numbers are misleading in isolation. The $7.1 billion market is geographically concentrated. Demand is strong in dense, renter-heavy urban and suburban pockets, and essentially absent in affluent, owner-occupied suburban areas. An investor who enters the wrong geography finds that no amount of national market optimism compensates for a neighbourhood where 80% of households own their own machines. Demand is conditional: conditional on location, which is precisely why this business scores lower on overall feasibility than the headline numbers might suggest.
2. Recession Resilience - Score: 7.5/10 (Grade: B)
Laundry is not discretionary, which gives this business genuine defensive qualities that most consumer-facing businesses lack. Consumer confidence falls. Dining out drops. Retail clothing shrinks. Core laundromat usage stays relatively flat.
The industry data supports this with important caveats. Revenue held through the 2008 recession, the 2020 pandemic disruption, and the inflation spike of 2022 to 2023. However, "held" is not the same as "thrived." Operators who cut corners on maintenance during downturns lost customers. Those running on thin margins with high utility costs saw profit evaporate even as volume stayed stable. Recession resilience applies to demand, not to margins, a distinction that scores this factor a B rather than an A. A well-run store in the right location will weather economic cycles. A poorly managed store in the right location will still suffer.
3. Repeat Customer Rate - Score: 8.0/10 (Grade: A)
This remains the strongest factor in the business's favour, and it is perhaps the most underappreciated statistic in the industry. According to one of our past survey data, approximately 90% of laundromat patrons become repeat customers. They come back every week or every two weeks, at predictable times, for the same service.
That repeat rate is the foundation of the business model. You are not chasing new customers constantly. You are serving a stable, habitual base. The implication for marketing is significant, once you acquire a customer through proximity and a good first experience, retention is largely automatic. The score sits at 8.0 rather than higher because that retention rate assumes the facility is well-maintained. Broken machines and a dirty floor break the habit quickly, and once a customer leaves for the competitor down the street, the habit forms there instead.
4. Revenue Potential - Score: 6.0/10 (Grade: C)
The revenue range for laundromats is so wide that the average number obscures more than it reveals. Annual revenue per store can fall anywhere between $15,000 and $600,000 depending on location, size, service mix, and management quality. That spread, a 40-to-1 ratio between the worst and best performers, is not a sign of a high-potential business. It is a sign of a business where outcomes are highly variable and heavily dependent on factors outside the revenue model itself.
Most established stores fall between $200,000 and $400,000 per year. That is a reasonable business, but it requires $100,000 to $500,000 of upfront capital to get there, years of operational attention, and favourable location dynamics. Revenue per square foot tells the same story: nationally, 21% of laundromats fall below $75 per square foot, a signal of operational inefficiency, outdated equipment, or simply the wrong trade area. In the Midwest, only 8% hit the top-tier $175-plus benchmark. The median outcome is not bad, but the variability is high enough that revenue potential earns a C.
5. Location Dependency - Score: 4.5/10 (Grade: D)
This is where the overall score gets pulled down significantly, and honestly, it should. Location dependency in the laundromat business is not a risk factor, it is the defining characteristic of the entire investment thesis. Get it right and the business has a natural moat. Get it wrong and nothing else you do will save it.
Unlike a product business, a laundromat cannot pivot its market. It cannot find new customer segments through digital marketing. It cannot rebrand into a different category. It cannot move. The location is the business, permanently and irrevocably. An operator who discovers 18 months in that the trade area has the wrong demographics has no strategic options other than to cut losses and sell.
This earns a D not because good locations do not exist, they do but because finding the right one requires deep analytical work that most investors do not do, and because even a small miscalculation in renter density, income profile, or housing stock age can be the difference between a thriving business and a losing one. The margin for error is narrow. The consequence of getting it wrong is severe. That combination belongs in the D tier. The entire next section of this article is devoted to what good location selection actually looks like.
6. Startup Cost - Score: 5.0/10 (Grade: D)
The capital requirements are real, front-loaded, and unforgiving. A new build from scratch can run from $500,000 to over $1 million. Acquiring an existing store ranges from $50,000 for a small underperformer to $500,000 or more for a well-run operation with strong cash flow. A value-add acquisition, buying an underperformer and upgrading it, typically requires $100,000 to $300,000 all-in. And that is before accounting for working capital to sustain operations through the stabilisation period.
What makes this a D rather than a C is the combination of high upfront cost and low liquidity once deployed. Unlike a retail or digital business, a laundromat's capital is locked into real estate leases, heavy equipment, and building infrastructure. If the location turns out to be wrong, or if a major equipment failure hits in year one before cash flow has built up reserves, the position is difficult to unwind. The 20 to 35% ROI figures cited by operators are real, but they describe the mature, stabilised state of a business that has already cleared the capital and operational hurdles of the first two to three years.
7. Utility Cost Risk - Score: 4.0/10 (Grade: D)
This is the single most dangerous underestimated risk in the business and scores the lowest of all eight factors. Water, gas, and electricity collectively represent 30 to 35% of a laundromat's operating costs, not as an edge case, but as a baseline. Every load of laundry consumes meaningful quantities of hot water, electricity for the motor and heat, and gas for drying. Multiply that across hundreds of machine cycles per day and the utility bill becomes the single largest operating expense after rent.
The risk is not just the absolute cost, it is the volatility. Rate increases, wastewater surcharges, and infrastructure inefficiencies in older buildings can compress margins rapidly and without warning. A municipality raising water rates by 15% does not consult the laundromat owner first. An aging building with inefficient plumbing quietly adds cost every month. The operators managing this risk best invest in high-efficiency commercial washers and heat-pump or gas dryers that can reduce utility consumption by 20 to 30% compared to legacy equipment, but that investment requires capital that many operators do not have at entry.
8. Competition Density - Score: 5.0/10 (Grade: C)
Competition exists in most viable markets precisely because viable markets attract competitors. The industry is highly fragmented, 74% of US laundromat owners operate one or two locations, which means most competitors are independent, owner-operated stores with limited marketing budgets, no loyalty programmes, and no service differentiation beyond location. On that dimension, competition is beatable.
The complicating factor is that dense renter markets, which are the only markets worth entering, tend to have multiple operators already. A trade area with 55% renter occupancy and 30,000 people within a mile radius is genuinely attractive, and you will not be the first person to notice. Mapping existing competitors and understanding their genuine weaknesses (poor ratings, limited hours, no wash-dry-fold, coin-only payment) is essential before committing. A market with two mediocre competitors and clear service gaps is an opportunity. A market with four established operators, one of whom recently renovated and runs 24/7, requires a much more compelling differentiation thesis.
Location: The Single Factor That Determines Everything
If there is one section of this analysis worth reading twice, it is this one.
We have looked at laundromats in affluent suburbs with 17% renter occupancy, $124,000 median household income, low crime, and barely a competitor within three miles. They fail, or at best limp along, because the demographic simply does not support the business model. Homeowners with incomes above $100,000 have in-home laundry. They do not need a coin laundry. Beautiful neighbourhood, wrong market.
We have also looked at laundromats in dense urban zip codes with 74% renter occupancy, median household income of $44,000, and four or five competitors within 1.5 miles. The demand is overwhelming, but the crime grade is D-minus, equipment is broken, and three competitors are already fighting for the same customers with aging facilities. Theoretically excellent demographics, operationally disaster.
The ideal location sits between those two extremes. Here is what the data shows actually works.
Renter Density: 40% minimum, 45–55% optimal. This is the single most predictive variable. Below 40% renter occupancy, the addressable market thins out significantly. Above 55%, demand is strong but competition is usually fierce. Target the 40 to 55% band in neighbourhoods with older housing stock, not new Class A apartment buildings, which almost always include in-unit laundry.
Population Radius: 15,000 to 25,000 people within 1 mile. At lower densities, you simply do not have enough foot traffic. At very high densities in major urban cores, competition is intense and real estate is expensive.
Household Income: $40,000 to $75,000 sweet spot. Below $40,000, customers are highly price-sensitive and usage frequency can be irregular. Above $75,000, in-home laundry ownership rises sharply and willingness to use a coin laundry diminishes. The working-class middle is your market, wage-earning, habitual, and underserved by premium laundry services.
Housing Stock: Older multi-family buildings. Purpose-built modern apartment complexes include in-unit laundry in 88% of cases. Older buildings, pre-1990 construction especially, frequently have shared or no laundry facilities. The older the housing stock in the trade area, the stronger the demand signal.
Transit Access. Many laundromat customers do not drive. Proximity to a bus route is not a nice-to-have, it is a demand multiplier. Laundromats on or near active transit corridors consistently outperform those that require a car.
Anchor Tenants. The best laundromat locations sit adjacent to grocery stores, dollar stores, discount retailers, or Walmart and Target. These anchor tenants drive foot traffic and create natural visit bundling, customers do their grocery shopping and their laundry on the same trip.
Crime Grade. This requires honest assessment. A facility in an F-rated crime area may have excellent demographic fundamentals on paper, but staff turnover will be high, insurance costs will be elevated, and customer comfort will be compromised. C or better is the target. D-rated areas require a significant risk premium and operational investment in security.
Practical diagnostic. Drive the area at 7am on a Saturday morning. Count the multi-family buildings within a half mile. Note whether people are on foot or transit. Walk into any existing laundromats and observe, are there customers? Are the machines working? Is it clean? The gap between what those stores are delivering and what you could deliver is your opportunity.
How Laundromats Actually Make Money
Most people think of a laundromat as a simple coin-operated business. Put in quarters, run the machine, collect the revenue. That mental model is accurate for the 1980s. The modern laundromat has three distinct revenue layers, and operators who only use the first one are leaving significant money on the table.
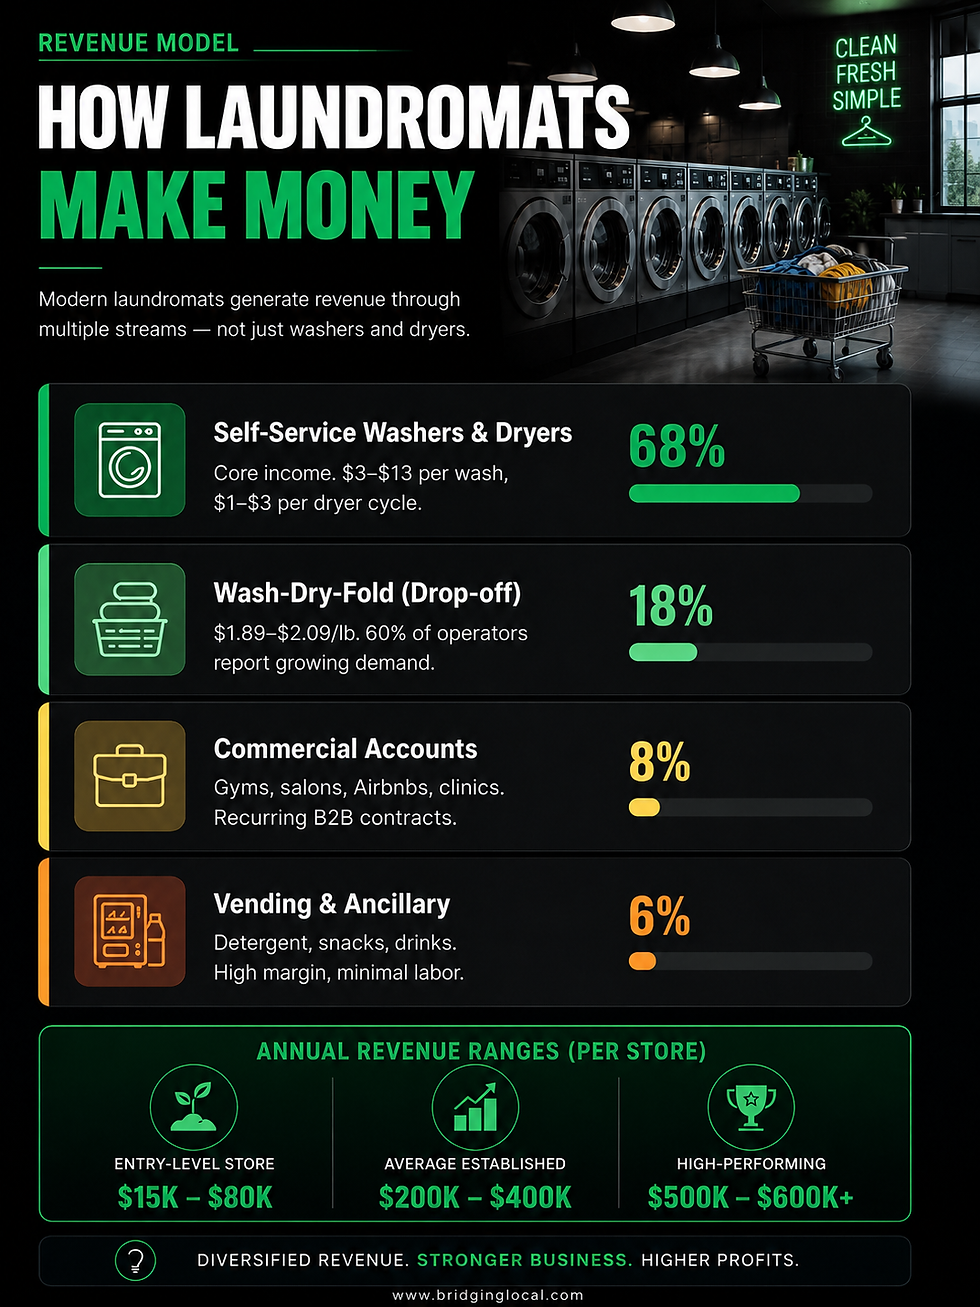
Layer 1: Self-Service (Core Revenue, ~68% of total)
Washer and dryer cycles remain the primary income driver. Pricing varies significantly by market and machine size. Top-load washers typically run $3.50 to $4.50 per cycle. Front-load and large-capacity washers run from $5 to $8. Oversized machines for comforters, duvets, and large loads can command $10 to $13. Dryer cycles run $1.00 to $3.00 depending on time increment.
Payment has shifted materially. While 71% of laundromats still accept quarters, a growing share supports laundry cards (42%), credit and debit cards (42%), and mobile app payments (25%). In the Midwest specifically, 50% of operators now accept card-based payments. A hybrid cash-plus-digital model is the current standard, essential for capturing both traditional customers and the growing share of younger, cashless users.
Operating this layer well means maintaining machines reliably, keeping the facility clean, and providing a safe, comfortable environment. These are the minimum requirements, not differentiators. If your machines break down and your floor is dirty, no amount of pricing strategy saves you.
Layer 2: Wash-Dry-Fold Drop-Off (~18% of revenue, growing fast)
Wash-dry-fold services are the fastest-growing segment in the industry. Customers drop off a bag of laundry, pay per pound, and pick up clean, folded clothes in a few hours or the next day. Pricing runs from $1.89 to $2.09 per pound with a minimum order, typically 10 pounds.
According to the Coin Laundry Association's industry survey, 60% of laundromat operators reported year-over-year growth in wash-dry-fold demand. Only 6% reported any decline. In the Midwest specifically, 28% of operators saw significant increases and 36% saw moderate increases, stronger-than-average growth that points to an underserved market.
Why is this segment growing? Dual-income households, working parents, and time-poor professionals are increasingly treating laundry as something to outsource rather than a task to manage personally. For this customer, the question is not "which machine is cheapest, it is "which place is most reliable and convenient." That shift in the value proposition supports higher margins per customer and longer retention.
Currently, 65% of US laundromats offer wash-dry-fold drop-off service. In the Midwest, only 56% do. That gap is a first-mover opportunity.
Commercial Accounts: The B2B Overlay [~ 8%]
Beyond retail customers, commercial laundry contracts represent a stable, recurring revenue stream that offsets retail volatility. Nationally, 51% of laundromats serve commercial accounts: gyms, hair salons, spas, Airbnb and VRBO operators, moving companies, daycares, medical and dental clinics, and small hotels.
These customers are different in important ways. They need consistent volume, fast turnaround, and reliable quality. They do not care about the coin slot or the payment app. They care whether their gym towels are clean and folded by 6am. Winning one strong commercial account can add tens of thousands of dollars in annual revenue with minimal marketing cost, because B2B referral rates in local services are high.
Ancillary Revenue [~ 6%]
Vending machines (soap, fabric softener, dryer sheets, bleach), snack and beverage vending, laundry bag sales, and premium machine tiers all contribute to total revenue. According to industry surveys, 87% of laundromats sell soap vending, 84% offer snack and beverage vending, and 73% sell laundry bags. These are not transformative revenue lines individually, but collectively they add margin at near-zero marginal cost once the infrastructure is in place.
Who Actually Uses Laundromats?
Understanding the customer deeply is not an academic exercise, it directly determines where you locate, how you price, what services you offer, and how you market. There are three distinct customer segments, each with a different profile and a different relationship with your business.
The Core Customer: The Habitual Renter
This is the foundation of the business. The ideal core customer is a renter, living in a household of three or more people, with an annual household income below $50,000 and no reliable in-home laundry access. They do laundry weekly. It is not a choice, it is a necessity built into their routine.
Demographic research consistently shows strong correlation between laundromat usage and specific population characteristics. Proximity to K-12 schools is another consistent positive signal, families with school-age children generate large, frequent loads. A renter penetration rate of 45 to 55% in the immediate neighbourhood is the minimum viable threshold for reliable core demand.
These customers become repeat visitors at a remarkable rate. Research shows 90% of laundromat patrons become regulars. Once they establish a routine at your facility and assuming you keep your machines working and your facility clean, they will come back every week with almost no marketing required.
The Convenience Customer: The Emerging Segment
This segment is growing and increasingly valuable. The convenience customer is a mid-to-upper-income renter or homeowner who uses laundromats selectively, for oversized items like comforters and duvets that do not fit a home machine, for time savings when the home machine is occupied, or for wash-dry-fold service when life gets busy.
This customer pays a premium willingly. They want cleanliness, reliability, modern equipment, cashless payment, and fast service. They are the natural audience for wash-dry-fold and pickup-and-delivery, and they have higher revenue per visit than the core customer. The strategic implication is that a laundromat positioned in a trade area that blends working-class renters with adjacent middle-income neighbourhoods can capture both segments simultaneously.
The Commercial Client: B2B Revenue
As described above, commercial clients like gyms, salons, healthcare providers, short-term rental operators, moving companies represent the most stable and highest-margin customer category. They are not walk-ins. They are relationships. Acquiring them requires outreach, a service level agreement, and reliable execution. Retaining them requires consistency.
One strong commercial client relationship can be worth $20,000 to $50,000 in annual revenue at minimal additional cost. A portfolio of five or six such relationships changes the financial profile of the business significantly.
What Makes Laundromats Fail: 5 Patterns That Show Up Again and Again
Analysing underperforming laundromats: including facilities that have received significant investment and still produce poor results: reveals five recurring failure patterns. These are not random. They are predictable, and they are avoidable.
Pattern 1: Wrong Neighbourhood
The most common cause of failure is also the simplest to diagnose in advance. Laundromats in affluent, owner-occupied, low-density suburban neighbourhoods do not have a customer base. Full stop. A facility in a neighbourhood with 17% renter occupancy, $124,000 median household income, and low-density single-family housing will not generate sustainable revenue regardless of how clean it is, how modern its machines are, or how well it is marketed.
Before evaluating any specific property, run the demographic check first. If renter occupancy is below 35% within a one-mile radius, the conversation is over.
Pattern 2: Aging and Broken Equipment
This is the most visible failure mode in customer reviews, and it is ruinous. A laundromat with broken machines loses customers immediately and permanently. People cannot afford to waste quarters and increasingly, they cannot afford to waste time on a machine that does not work. One bad experience sends them to your competitor, and it only takes two or three bad experiences before they stop coming back at all.
The pattern is self-reinforcing. Broken machines reduce revenue. Reduced revenue limits reinvestment. Limited reinvestment means machines stay broken. The facility enters a decline spiral that is difficult to reverse without a complete equipment refresh.
When acquiring an existing laundromat, the condition of the machines is not a secondary consideration, it is the primary consideration. Budget for a full equipment refresh as a baseline assumption, not a contingency.
Pattern 3: Underestimating Utility Costs
Many first-time operators build their financial model on revenue projections and ignore the utility line. When the first full month of utility bills arrives, the margin picture shifts dramatically. Water, electricity, and gas at full operational volume are not small numbers.
The mitigation is twofold: invest in high-efficiency equipment upfront (which costs more but pays back in lower operating costs over time), and negotiate utility contracts carefully before signing a lease. Some older buildings have genuinely inefficient plumbing and electrical infrastructure that cannot be cost-effectively upgraded. Walk away from those properties regardless of the demographic opportunity.
Pattern 4: Self-Service Only, No Value-Added Services
Laundromats that offer only coin-operated self-service are competing on convenience and proximity alone. As pickup-and-delivery services expand and consumer expectations for convenience increase, the self-service-only model becomes progressively less defensible. Customers who want wash-dry-fold or delivery will find an operator who offers it.
The strategic response is not to abandon self-service, it remains the primary revenue driver, but to add the service layers on top of it as demand warrants. Start with drop-off wash-dry-fold, which requires minimal additional capital but meaningfully differentiates the offering. Layer in pickup and delivery once you have the operational systems in place. The incremental investment is modest. The revenue and retention impact is significant.
Pattern 5: No Digital Presence or Active Reputation Management
In the Midwest, 74% of laundromat operators rely on word of mouth as their primary marketing channel. Only 49% have a Google Business listing actively managed. Social media adoption is minimal.
This is simultaneously a weakness for incumbents and an opportunity for new entrants. A laundromat with 50 recent Google reviews averaging 4.6 stars, an active Instagram presence, and a simple website with pricing information will capture a meaningfully higher share of new residents in the trade area than a competitor with 15 reviews averaging 3.1 stars and no web presence.
The cost of building this is low. The benefit compounds over time.
Build New or Acquire Existing?
This is a strategic question that every serious laundromat investor faces, and the answer is not obvious.
Building from scratch gives you full control over location selection, facility design, equipment specification, and layout optimisation. You start with modern machines, a fresh interior, and no legacy reputation to overcome. The downsides are substantial: new builds cost $500,000 to $1 million or more, the timeline from lease signing to opening is typically six to twelve months, and you start with zero revenue and zero customer base.
Acquiring an existing store means immediate cash flow from day one. The customer base already exists. The equipment is already installed. The landlord relationship is already established. The critical risk is what you do not know going in, hidden equipment problems, deferred maintenance, negative reviews that have chased away loyal customers, or structural issues with the building.
The industry data in the Midwest is particularly interesting here. 27% of operators plan to acquire existing laundromats the highest share of any US region. Meanwhile, 26% of current operators plan to sell their assets. That combination creates favourable conditions for buyers. There is a substantial volume of underperforming, owner-operated laundromats available for acquisition at reasonable valuations.
The value-add acquisition model, buying an underperforming store at a price that reflects its current weak performance, then investing in equipment, operations, and marketing to realise its potential has the strongest risk-adjusted return profile in the current market. You are paying for current reality, not future potential, while capturing the upside yourself.
The due diligence process for an acquisition needs to cover machine condition and age, utility cost history, lease terms and remaining duration, customer review history, revenue documentation, and local competitive dynamics. Shortcuts here are expensive.
The Industry Trends Shaping the Next Five Years
Beyond the fundamentals, eight trend lines are reshaping how laundromats compete and what customers expect.
Wash-dry-fold demand is rising. Sixty percent of operators nationally report year-over-year growth. This is not a cyclical blip, it reflects a fundamental shift in how busy households manage their time. The laundromat that positions itself as a time-saving service rather than a facility will capture this trend.
The industry is fragmenting in the right direction for buyers. Seventy-four percent of owners run one or two locations. Twenty-seven percent plan to sell assets. The consolidation window is open, and it will not stay open indefinitely as national chains become more active acquirers.
Payment is shifting hybrid. Quarters are not dead - 71% of laundromats still accept them, but the trend is clearly toward cards and app-based payments. Facilities that accept only coins are progressively excluding younger, cashless customers. A hybrid payment system is the minimum investment for any serious operator.
Commercial B2B is mainstream. Fifty-one percent of laundromats nationally serve commercial accounts. This is no longer a niche offering, it is a standard revenue layer that most well-run operations include. Operators who have not developed commercial relationships are running below their revenue potential.
Digital marketing adoption is low but rising. In the Midwest, only 49% of operators have optimised Google Business listings and fewer still run paid digital advertising. This creates a clear, low-cost competitive advantage for operators willing to invest basic effort in their online presence.
Energy efficiency is becoming a competitive necessity. New high-efficiency commercial machines can reduce water and energy consumption by 20 to 30% compared to legacy equipment. As utility costs continue to rise, the efficiency gap between modern and legacy equipment translates directly into margin advantage.
Pickup and delivery is the largest underexploited opportunity. Only 38% of Midwest operators offer it. In most markets, a single operator who builds a reliable, well-marketed pickup and delivery service will capture a disproportionate share of the convenience customer segment with minimal competition.
The consolidation wave is building. National laundromat chains are growing. Private equity is entering the sector. Operators who build a portfolio of three to five well-run, modern locations are positioning themselves for a meaningful exit opportunity either to a strategic buyer or through recapitalisation by a regional growth platform.
The Financial Reality: What the Numbers Actually Look Like
Let us be concrete about the financial profile.
Revenue ranges by operator type:
Entry-level or underperforming store: $15,000 to $80,000 annually
Average established store: $200,000 to $400,000 annually
Strong performer with full service mix: $400,000 to $600,000 annually
Top 18% of operators nationally: $600,000 or more annually
Cost structure:
Utilities (water, gas, electricity): 30 to 35% of revenue
Rent: 15 to 20% of revenue depending on market
Labour: 10 to 20% depending on service mix (self-service only needs minimal staff; wash-dry-fold and delivery require more)
Equipment maintenance and refresh: 5 to 10%
Insurance, licences, marketing: 3 to 6%
Profitability:
Industry average net margin: 13.9% in 2025
Well-run operations with modern equipment: 18 to 25% net margin achievable
Return on investment: 20 to 35% reported by operators in the Laundry Biz Center analysis
Capital requirements:
Equipment only (refresh of existing store): $50,000 to $150,000
Value-add acquisition including purchase and refresh: $100,000 to $300,000
Acquisition of established, well-run store: $150,000 to $500,000
New build from scratch: $500,000 to $1,000,000+
Equipment lifespan:
Commercial washers and dryers: 10 to 15 years with proper maintenance
This long lifespan is one of the structural advantages of the business, equipment depreciation per unit of revenue is relatively low once machines are in service
The valuation question. Laundromats are typically valued as a multiple of seller's discretionary earnings (SDE), usually in the range of 2.5 to 4.0 times, or as a percentage of annual gross revenue, typically 50 to 80%. A store generating $250,000 in revenue might be listed for $150,000 to $200,000. A store generating the same revenue but with strong growth trajectory and modern equipment might command 3 to 4 times SDE. Understanding valuation methodology is essential before making an offer.
The 4 Conditions for Success
After working through all of this data, the honest verdict is nuanced: a laundromat can be a genuinely good business for the right investor in the right location with the right approach, but the conditions attached to that "right" are more demanding than most people expect going in. It is not a passive income machine. It is not a business that rewards undercapitalised investors who treat location selection as an afterthought. It is not forgiving of operational neglect. But for a disciplined, patient investor who respects what the data actually says, the combination of structural demand, repeat customer retention, and recession-resistant revenue creates a credible opportunity.
Success comes down to four conditions.
Condition 1: Pick the right location. Forty percent or more renter occupancy, dense population within a one-mile radius, working-class household income in the $40,000 to $75,000 range, older multi-family housing stock, transit access, and strong anchor tenants nearby. If the location does not check these boxes, do not proceed regardless of price.
Condition 2: Start with self-service, then layer services as you scale. Build the foundation first. Get machines working reliably, get the facility clean, get ratings up. Once self-service is stabilised, add wash-dry-fold. Once wash-dry-fold is running, build the pickup and delivery infrastructure. Each layer adds margin and customer stickiness without disrupting the core operation.
Condition 3: Modernise equipment and payments. A hybrid payment system cash, coin, card, and app, is not optional in 2025. High-efficiency machines are not optional if you want to manage your utility costs. This is not about luxury. It is about operational viability.
Condition 4: Treat it as a real business. Build your Google Business profile and manage it actively. Respond to every review. Keep the facility spotless. Know your regular customers by name if you have staff on site. Run seasonal promotions. Get into the community. The laundromats that win are not the cheapest or the closest, they are the ones that are most clearly and consistently better than the alternative.
Final Verdict: 6.0/10 Overall Feasibility Score
A 6.0 out of 10 is a sober but honest assessment. Three factors score in the D tier: location dependency, startup cost, and utility cost risk and they are not minor concerns. They are the central structural challenges of the business. The factors that score well repeat customer rate, recession resilience, and market demand are real and meaningful, but they do not override the difficulty of finding the right location, deploying the required capital, and managing operating costs that are largely outside your control.
What this score means in practice: a laundromat is a viable business for a disciplined, well-capitalised investor who approaches it analytically. It is a poor business for someone who is undercapitalised, unwilling to do rigorous location research, or expecting passive income with minimal operational involvement.
The gap between a 4 out of 10 outcome and an 8 out of 10 outcome in this business comes down almost entirely to location selection and operational discipline. That gap is not random, it is the direct result of whether the investor did the homework before committing. This article is that homework.
The laundromat is not the most glamorous business idea. It has never been. But in the right hands, in the right location, with the right approach, it is a cash-flowing, recession-resistant, community-anchored business with genuine exit optionality as consolidation in the sector accelerates. The 6.0 score reflects what the average investor should expect. The disciplined ones can do meaningfully better.
This analysis is based on industry data from various databases. All figures are US-based unless otherwise stated. Individual market conditions will vary. This article is for informational purposes and does not constitute investment advice.
Research and analysis by Bridging Local - bridginglocal.com


Comments