Canadian Real Estate Market Outlook 2026: Permit Value Up, Housing Units Down

Canadian building permit value reached $95.25 billion in the first seven months of 2026, up 6.6% on last year. The number of dwelling units approved fell 5.8% over the same period. Here is what sits behind both figures.
Canadian municipalities approved 172,482 new dwelling units in the first seven months of 2026, down 5.8% from the same period in 2025. Over those same months, the total value of building permits issued rose 6.6% to $95.25 billion.
Permit value is the standard measure people quote when describing the health of Canadian construction. It is also the measure least connected to housing supply. The two numbers moved in opposite directions this year, and understanding why matters for anyone building, financing, supplying or investing in Canadian real estate.
All figures in this article are drawn from Statistics Canada building permit data covering January 2024 through July 2026, reported unadjusted in current dollars. Building permits are a forward indicator. They record work approved rather than work completed, which typically leads actual construction activity by six to eighteen months depending on project type and scale.
We pulled the full national and provincial detail across residential, commercial, industrial and institutional building types and worked through it. What follows is where Canadian construction demand is rising, where it is falling, and one significant caveat on the headline growth figure.
Canadian Building Permit Value Reached $95.25 Billion Through July 2026
Total permit value for the first seven months of 2026 came to $95.25 billion, up 6.6% on the same period in 2025 and 12.2% on 2024. Residential accounted for $55.31 billion and non-residential $39.94 billion.


The number of permits issued fell 1.1% to 226,627. Fewer permits carrying higher total value means the average approved project is larger, which is consistent with a shift toward multi-unit residential and large non-residential work.
A Single Month Accounts for Most of the 2026 Increase
June 2026 recorded $20.09 billion in permit value against $14.74 billion in June 2025. Institutional and governmental permits alone reached $6.05 billion that month, compared with a typical monthly range of $1.0 billion to $2.9 billion across the rest of the series.
That single month carries the national growth figure. Excluding June from both years, total permit value grew 0.7% rather than 6.6%.

Institutional permit value for the seven months was $15.46 billion, of which June contributed 39%. Removing it from both years turns a 27.1% increase into a 2.4% decline. The institutional category is prone to this because a single hospital, university or transit facility can be worth more than a full month of ordinary approvals.
"Building permit data is lumpy by construction. One large approval in one month can move a national annual figure by several percentage points."
Residential Permit Value Is Flat While Housing Units Fell 5.8%
Residential permit value reached $55.31 billion, up 0.2% on 2025 and 5.3% on 2024. Dwelling units approved fell to 172,482, down 5.8% on 2025 and up 4.8% on 2024.

Flat dollar value against falling unit counts means cost per approved unit rose. Average permit value per dwelling unit was $319,182 in 2024, $301,537 in 2025 and $320,673 in 2026. The 2026 figure is 6.3% above 2025 and slightly above 2024.

Permit value reflects the declared construction cost of the project. Rising cost per unit alongside falling unit counts points toward higher input and labour costs being carried into new applications, rather than toward a shift to larger or more expensive homes.
Single Family Approvals Fell Faster Than Apartments
Both residential categories declined in unit terms, with single dwellings falling further.


Multiple dwellings account for 83.3% of all units approved and 65.5% of residential permit value. Against 2024 the two categories diverge: multiple dwelling units are up 7.9% while single dwelling units are down 8.1%. The multi-unit share of new Canadian housing approvals continued to rise across the period.
Two year view on housing approvals. Against 2024, total dwelling units are up 4.8% and residential permit value is up 5.3%. Against 2025, both are lower. The 2025 comparison period was unusually strong for multi-unit approvals, particularly March and July, which makes the single year decline look sharper than the underlying two year direction.
Non-Residential Permits Grew 17% Led by Industrial Construction
Non-residential permit value reached $39.94 billion, up 17.0% on 2025 and 23.4% on 2024. It is the fastest growing part of the Canadian construction pipeline on both comparisons.


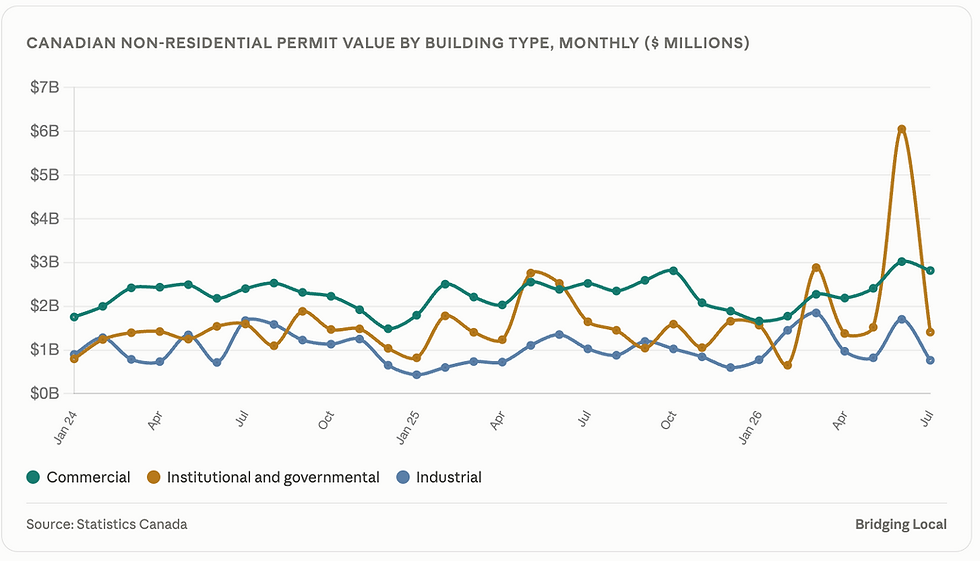
Industrial permits reached $8.33 billion, the strongest single year growth of any building type at 39.4%. February and March 2026 were both above $1.4 billion, against a 2025 range that mostly ran between $430 million and $1.35 billion.
Commercial permit value was close to flat at 0.9% on 2025 and 2.9% on 2024, sitting at $16.15 billion. It remains the largest non-residential category by value. Institutional is covered above and should be read alongside the June adjustment.
Building Permit Growth by Province: PEI, Manitoba and Quebec Lead
Provincial results vary widely. Four provinces grew permit value by more than 15% while two declined by double digits.


Ontario accounts for 39.4% of national permit value at $37.5 billion, Quebec 20.4% at $19.4 billion, British Columbia 17.8% at $16.9 billion and Alberta 11.8% at $11.2 billion. Those four provinces represent 89.4% of the national total, so movement in the smaller provinces changes local conditions without materially shifting the national picture.
Saskatchewan recorded the largest increase in dwelling units approved at 40.0%, reaching 4,781 units, alongside 16.2% growth in permit value. It is the only province where unit growth substantially outpaced value growth, which points to approvals weighted toward lower cost housing types.
Alberta and Nova Scotia Permit Value Declined
Two provinces fell on both measures. Alberta permit value dropped 17.2% to $11.2 billion with dwelling units down 13.4% to 30,208. Residential value fell 12.3% and non-residential fell 25.2%.

Alberta still approved 30,208 dwelling units, the third highest of any province behind Ontario and Quebec, so the decline runs from a high base rather than from weakness. Against 2024, Alberta permit value is up 2.3%, which places the 2026 fall against an unusually strong 2025 rather than a sustained contraction.
Nova Scotia recorded the sharpest decline at 30.3%, with residential value down 20.8%, non-residential down 45.8% and dwelling units down 22.9% to 4,675. Against 2024 the province is down 14.8%, so the direction holds across both comparison years.
Quebec Is the Only Large Province Growing on Both Measures
Among the four provinces that make up the bulk of Canadian construction, Quebec is the only one where permit value and dwelling units both increased.

Quebec permit value grew 14.2% to $19.4 billion with 43,989 units approved, up 9.1%. Residential value grew 15.3% and non-residential 11.9%, so the growth is broad rather than concentrated in one building type.
Ontario grew value 10.3% while units fell 6.7%, with residential value down 3.2% and non-residential up 27.6%. British Columbia grew value 12.8% while units fell 10.2%, with residential value down 4.4% and non-residential up 51.0%. In both provinces the value growth came entirely from non-residential work while housing approvals contracted.
The pattern in the two largest housing markets. Ontario and British Columbia together approved 75,815 dwelling units in the first seven months of 2026, down from 82,382 in the same period of 2025. Both provinces show headline permit growth driven by commercial, industrial and institutional projects while residential approvals moved the other way.
Where This Data Stops and Custom Research Begins
Everything above tells you how much construction was approved, where and in what category. It does not tell you which projects will proceed, what buyers or tenants in a given market actually want, or whether the conditions showing up nationally apply to a specific site, segment or price point.
A 6.6% national increase becomes 0.7% once a single month is removed. Ontario shows permit growth and housing decline at the same time. Alberta reads as a sharp fall against 2025 and modest growth against 2024. Aggregate permit data raises more questions than it settles for anyone making a real decision.
If you are working through a decision in Canadian real estate and need evidence rather than inference, that is the work we do. Custom surveys, in-depth interviews, competitive analysis and market deep dives, built around your specific question.
Frequently Asked Questions
What is the outlook for Canadian real estate in 2026?
Building permit value reached $95.25 billion in the first seven months of 2026, up 6.6% on the same period in 2025. Excluding an unusually large June, the underlying increase was 0.7%. Residential permit value was flat at 0.2% growth while dwelling units approved fell 5.8% to 172,482. Non-residential permits grew 17.0%, led by industrial at 39.4%. Permits are a forward indicator, typically leading construction activity by six to eighteen months.
How many new homes were approved in Canada in 2026?
Canadian municipalities approved 172,482 dwelling units in the first seven months of 2026, down 5.8% from the same period in 2025 and up 4.8% on 2024. Multiple dwelling units accounted for 143,658 of those approvals and single dwellings 28,824. Single dwelling approvals fell 7.2% on 2025 and 8.1% on 2024, declining faster than multi-unit approvals.
Which Canadian province has the most construction activity in 2026?
Ontario leads with $37.5 billion in permit value, 39.4% of the national total, followed by Quebec at $19.4 billion, British Columbia at $16.9 billion and Alberta at $11.2 billion. By dwelling units approved, Ontario leads at 48,612, followed by Quebec at 43,989, Alberta at 30,208 and British Columbia at 27,203. Those four provinces account for 89.4% of national permit value.
Why is Canadian permit value rising while housing units fall?
Two factors. First, non-residential construction grew 17.0% while residential was flat, so a growing share of total permit value is commercial, industrial and institutional work rather than housing. Second, average permit value per dwelling unit rose from $301,537 in 2025 to $320,673 in 2026, a 6.3% increase, meaning the same or fewer units carry a higher declared construction cost.
Which Canadian provinces saw construction decline in 2026?
Alberta permit value fell 17.2% to $11.2 billion with dwelling units down 13.4%, though against 2024 the province is still up 2.3%. Nova Scotia fell 30.3% with units down 22.9% and is also down 14.8% against 2024. New Brunswick was close to flat at 0.9% growth. All other provinces recorded permit value increases.
Are building permits a reliable indicator of construction activity?
They are a useful forward indicator because they record approved work ahead of construction, typically by six to eighteen months. They are also lumpy. A single large institutional or industrial approval can move a monthly or annual figure substantially, as June 2026 did, when institutional permits reached $6.05 billion against a normal range of $1.0 billion to $2.9 billion. Permits also record approvals rather than completions, and not every approved project proceeds.
About This Analysis
This analysis was produced by Bridging Local (RC Research & Insights Inc.), a Vancouver-based market research and business consulting firm, using Statistics Canada building permit data. We run primary research across B2B and B2C markets, including surveys, in-depth interviews, competitive analysis, market deep dives and go-to-market strategy.
If you are sizing a market, testing a concept, or working out where demand sits in your category, our market research services are built for exactly that.


Comments